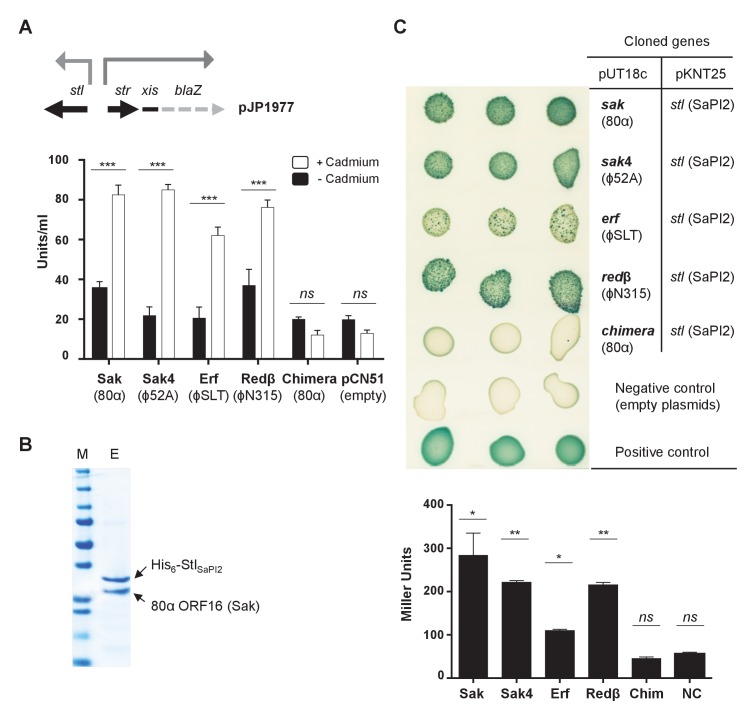
Figure 6. Phage SSAPs bind SaPI2 Stl protein.
(A) Derepression of str transcription by ssap expression. Top, schematic representation of the blaZ transcriptional fusion generated in plasmid pJP1977. Bottom, strains containing pJP1977- and pCN51-derivative plasmids expressing the different SSAPs under study were assayed for β-lactamase activity in the absence of or 3 hr after induction with 5 μM CdCl2. Samples were normalized for total cell mass. Experiment data is in triplicate. Error bars represent SEM. A 2-way ANOVA with Sidak's multiple comparisons test was performed to compare mean differences within rows. Adjusted p values were as follows: Sak = 0.0001***, Sak4 = 0.0001***, Erf = 0.0001***, Redβ=0.0001***, chimera = 0.999ns. ns, not significant. (B) Affinity chromatography of 80α Sak (ORF16) using His6–StlSaPI2. E. coli strain expressing the pair was isopropyl-β-D-thiogalactoside (IPTG)-induced and, after disruption of the cells, the expressed proteins were applied to a Ni2+ agarose column and eluted. The presence of the different proteins was monitored in the elute fraction (E) by Coomassie staining. M: molecular weight marker. (C) Bacterial adenylate cyclase-based two-hybrid (BACTH) analysis. Spots in each row represent three independent colonies. Plasmid combinations are indicated in the right columns. Bottom, quantification of the BACTH analysis after 2 hr of IPTG (5 mM) induction. Experiment data is in triplicate. Error bars represent SEM. A 1-way ANOVA with Sidak's multiple comparisons test was performed to compare mean differences within rows. Adjusted p values were as follows; Sak = 0.0221*, Sak4 = 0.0030**, Erf = 0.0158*, Redβ=0.0014**, chimera (Chim) = 0.1980ns. ns, not significant.

