. 2017 Aug 31;6:e26642. doi: 10.7554/eLife.26642

Figure 1. Experimental setup and contrast-dependent V1 gamma frequencies.

(A) Schematic rendering of recording location. Two to three laminar probes were inserted with 1–6 mm separation in cortical area V1. (B) The visual paradigm consisted of a 1 s baseline period with a gray background and 2 s visual stimulation with a full-screen static grating characterized by spatially varying local contrast. During both periods the monkeys maintained their gaze on a fixation point (controlled by eye tracking). For analysis, the stimulation period (0.2–2 s) was used, not including the first 200 ms to avoid stimulus-evoked transients. Two receptive fields (RF) from different probes are shown on the grating stimulus (blue and red circles). The aim was to modulate (detune) the local frequencies of gamma rhythms using local contrast differences. (C) Spectral power relative to baseline as a function of V1 cortical depth (36.5% contrast, population average, M1). Data for gamma analysis are taken from granular and superficial layers (dashed box) unless stated otherwise. (D) Local contrast modulated gamma frequency (population average, M1) as shown in the power spectral profile for three of the five contrast values employed. Width of shaded area represents SE.

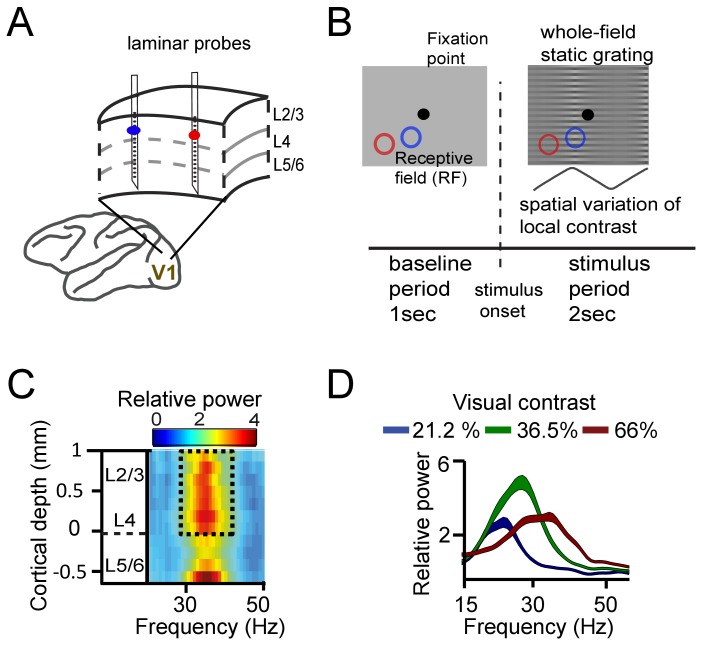
Figure 1.

Figure 1—figure supplement 1. Cortical depth alignment and analysis.

Figure 1—figure supplement 1.

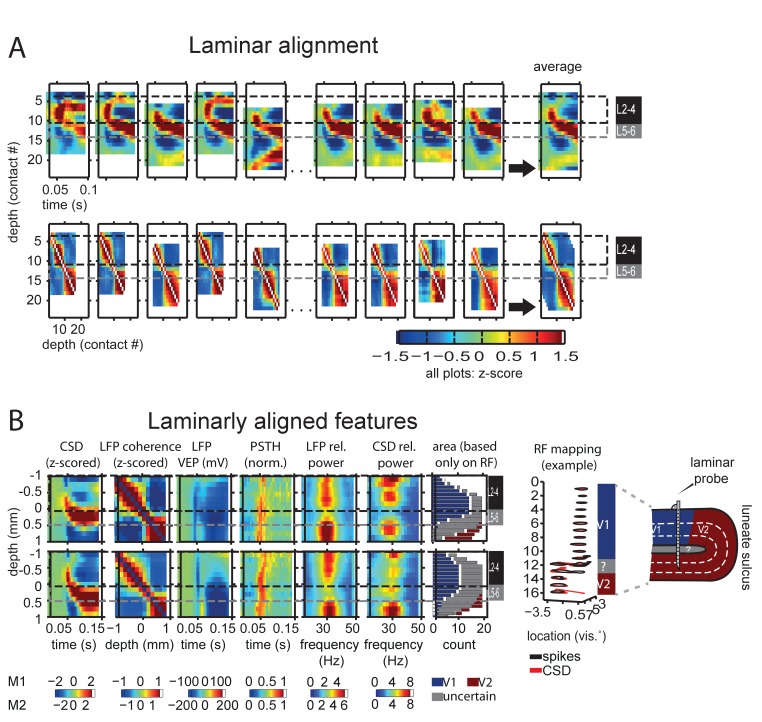
(A) Alignment procedure: CSDs from single sessions and probes were shifted iteratively to minimize the squared error between all probes using a parallel tempering algorithm until an optimal constellation of shifts was reached. Gamma-range coherence was then used to confirm or improve the constellation (see text for details). From left to right: example sessions from the first few and last few recording days, at the very right: average across all sessions, including sessions not shown here. Top row: CSD, bottom row: gamma-range coherence during baseline grey screen period. Black/grey lines indicate location of layers 2–4 versus 5–6. Example sessions are taken from monkey M2. (B) Depth-aligned grand average features per monkey, top row monkey M1, bottom row monkey M2. Black/grey lines indicate location of layers 2–4 versus 5–6. Zero indicates last channel included in L2-4, black/grey lines overlap the reversal point. From left to right: CSD, LFP gamma-band coherence as used for alignment, visual evoked potential, peristimulus time histogram (PSTH), LFP and CSD power in the gamma range, area assignment based on receptive field jumps. The PSTH of each session was normalized to the maximum activity of the maximally active spike channel. Relative power was computed as stimulus/baseline (baseline averaged across trials) for both LFP and CSD. The rightmost column shows the number of contacts assigned to each depth and their assignment to V1 vs. white matter or V2 based on receptive field mapping alone, providing an estimate independent of the CSD reversal point. Grey contacts were either those positioned likely in white matter, just preceding a receptive field jump, or all contacts if no receptive field jump was present (most likely representing all contacts still in V1). An example RF mapping to the right together with a sketch illustrates this procedure. Receptive fields as estimated by spiking (black) and CSD (red) show a clear jump at contact 14, entering the deep layers of V2, the two contacts above cannot be assigned unambiguously.
Figure 1—figure supplement 2. Effect of contrast and eccentricity on macaque V1 gamma frequency.

Figure 1—figure supplement 2.

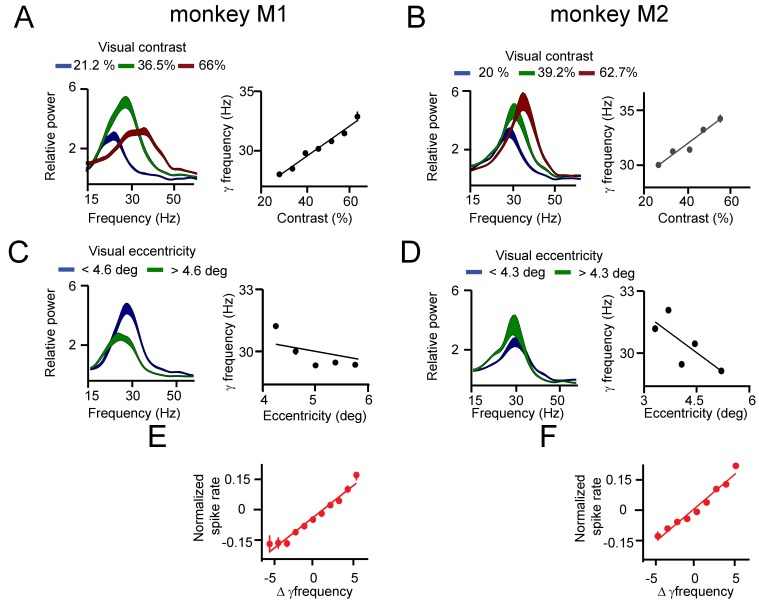
(A) On the left, the relative power spectra (15–55 Hz) of monkey M1 are shown for three representative grating contrasts (see Table S1) showing a monotonic increase in the preferred frequency range and a nonlinear power change with contrast. To the right, the dependence of (instantaneous) gamma frequency and local contrast is quantified. (B) The same as in A, but for monkey M2. (C) Left, the power spectra of contacts in monkey M1 with lower eccentricity (<4.6 deg) and higher eccentricity (>4.6 deg) are shown. A decrease in the peak frequency with higher eccentricity can be observed. This is quantified on the right in the plot of estimated gamma frequency and eccentricity. (D) The same as in C, but for monkey M2. (E) The MUA spike rate was similarly correlated with contrast and eccentricity as was gamma frequency in M1. In general, we observed that MUA spike rate difference among V1 locations predicted well changes in gamma frequency difference. (F) The same as in E, but for monkey M2.