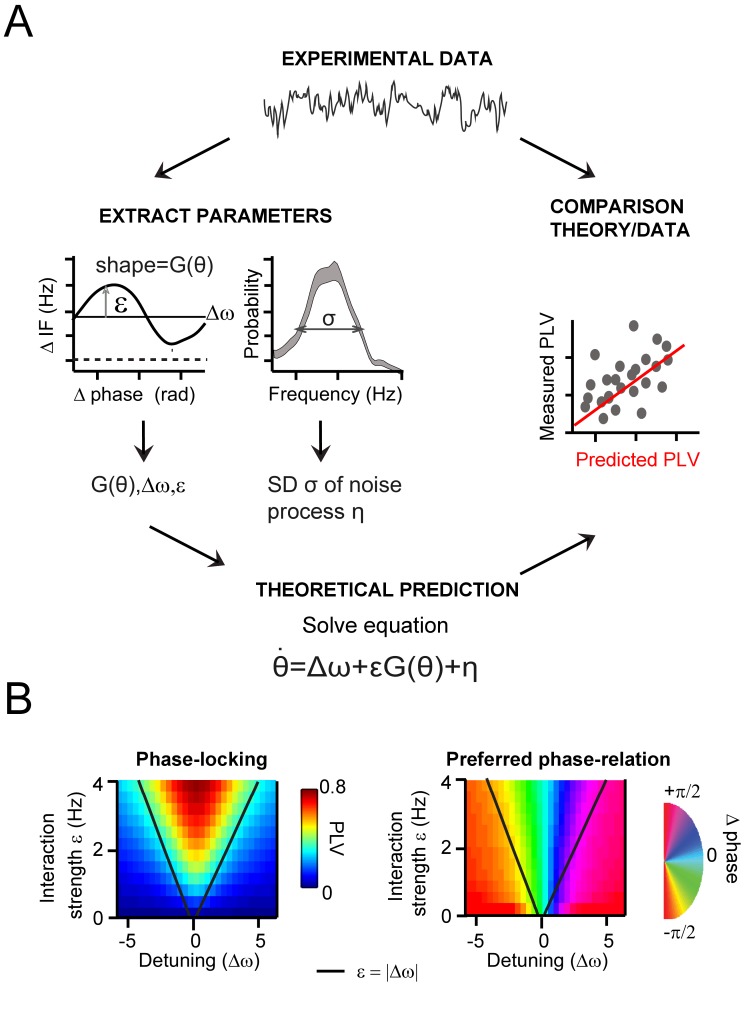
Figure 5. .General approach to derive and evaluate the theoretical predictions.
(A) Schematic illustration of the main procedure to derive and evaluate the theoretical predictions for gamma PLV. From the experimental data (instantaneous frequency difference, top) we needed to estimate the function G(θ) and the parameters ε, Δω and σ to solve Equation 1 (bottom), obtaining PLV predictions. We extracted (left) the function and parameters using observed (for G(θ),ε, Δω) and the gamma frequency distribution (for σ). We then solved Equation 1 for each contact pair and compared directly the predicted and observed PLV (right, where each point represents one condition and contact pair) (B) The prediction of the Arnold tongue. In the parameter-space of ε and Δω, a characteristic inverted triangular-shaped synchronization region is as expected from TWCO. Left is the analytically derived PLV from Equation 1 (where G(θ) being a sinusoid function and σ = 18 Hz). The black line represents the equality (ε=|∆ω|), which sharply defines the Arnold tongue in the noise-free case. Right the mean phase difference is mapped showing a gradual change of phase-difference along the detuning dimension.


