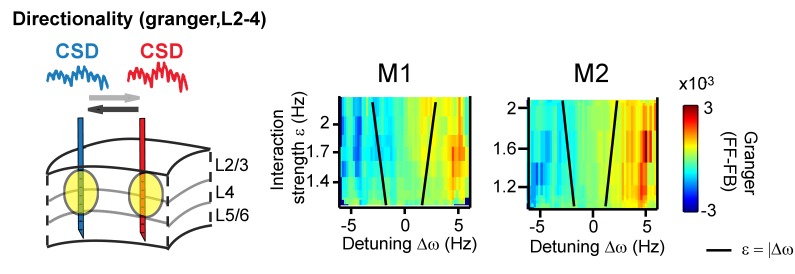
Figure 8. Same analysis as in Figure 7, but applying (non-stationary) granger causality directionality measure (X→Y vs X←Y).
In line with phase-difference maps, the directionality influence flips as a function of detuning for monkey M1 (left) and M2 (right).

