. 2017 Aug 22;6:e27592. doi: 10.7554/eLife.27592

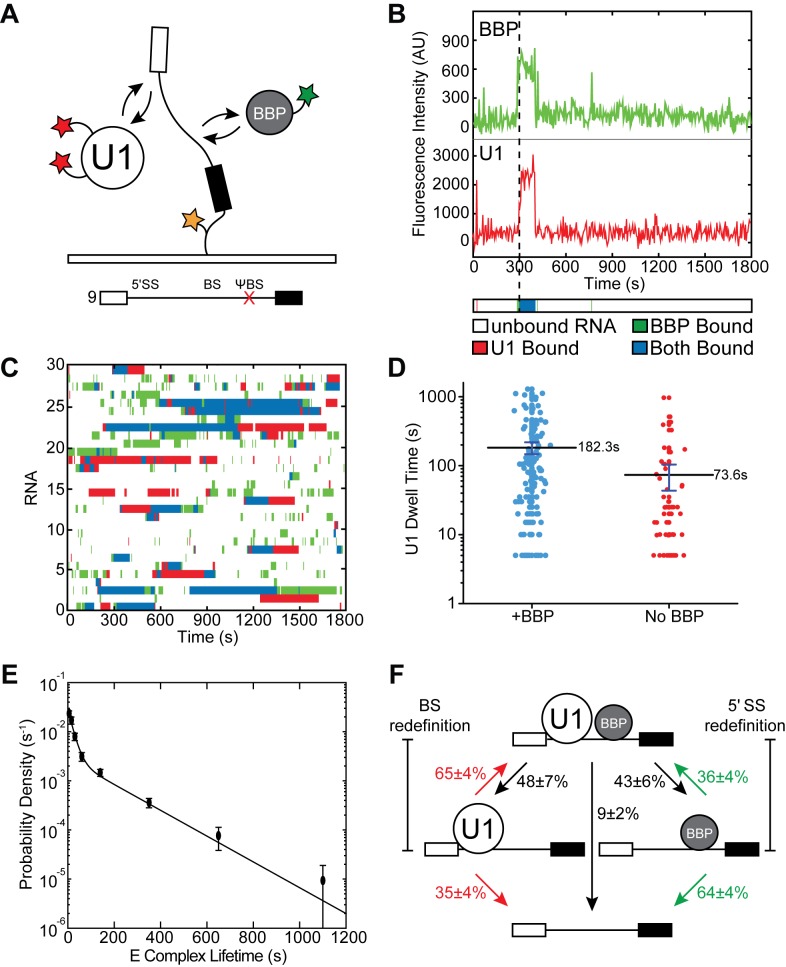
Figure 3. Three-color CoSMoS observation of U1 and BBP binding dynamics.

(A) Schematic of a three-color experiment in which U1 was labeled with two red-excited (Cy5) fluorophores, BBP was labeled with a single green-excited (Dy549) fluorophore, and the surface-tethered pre-mRNA was labeled with an Alexa488 fluorophore. Shown below is a graphic representation of the capped, immobilized RNA used in these three-color experiments. (B) Representative time records showing peaks in fluorescence intensity corresponding to colocalization of BBP (green) and U1 (red) with the same individual pre-mRNA molecule. The dashed line demarks the arrival of U1. Shown below the time record is the corresponding time ribbon in which U1 and BBP binding are represented by red and green bands, respectively. Colocalizations of U1 and BBP are represented by blue bands. (C) Rastergram depicting typical U1 and BBP binding events and colocalization on immobilized RNAs. (D) Measured U1 lifetimes in the presence or absence of BBP colocalization. The mean lifetimes are noted ±S.E. (E) Probability density histogram of dwell times for colocalized U1 and BBP complexes. The lines represent the fit of the distribution to an equation containing two exponential terms. Details of the fit parameters can be found in Supplementary file 5. (F) Routes for loss of either U1 or BBP fluorescent spots from immobilized RNAs following their colocalization. Percentages represent the fraction of U1/BBP complexes in which fluorescence disappeared by the indicated pathway (N = 173 initial colocalized U1/BBP complexes). Error bars in (E and F) represent the error in counting statistics as given by the variance of a binomial distribution.

Figure 3.

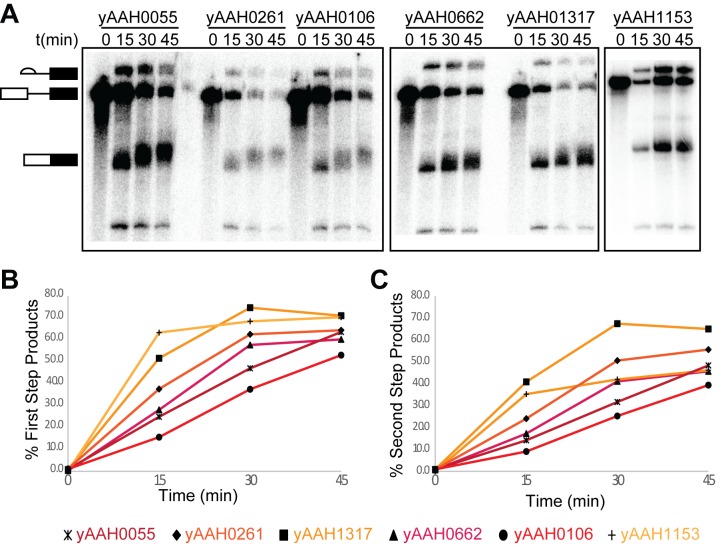
Figure 3—figure supplement 1. Characterization of U1- and BBP-labeled yeast splicing extracts.

Figure 3—figure supplement 1.

(A) Phosphorimaging of the [32P]-labeled RNAs generated from in vitro splicing assays carried out with WCE prepared from the given strains. (B) Quantification of the results shown in (A) depicting the accumulation of the fraction products that had completed the 1st chemical step in splicing (lariat intron-3' exon and mRNA) over time for labeled extracts. (C) Quantification of the results shown in (A) depicting the accumulation of the fraction of second step product (mRNA) over time for labeled extracts. Descriptions of the each WCE corresponding to numbers listed in (A–C) can be found in Supplementary file 4.
Figure 3—figure supplement 2. U1- and BBP-labeled WCE forms commitment complexes.
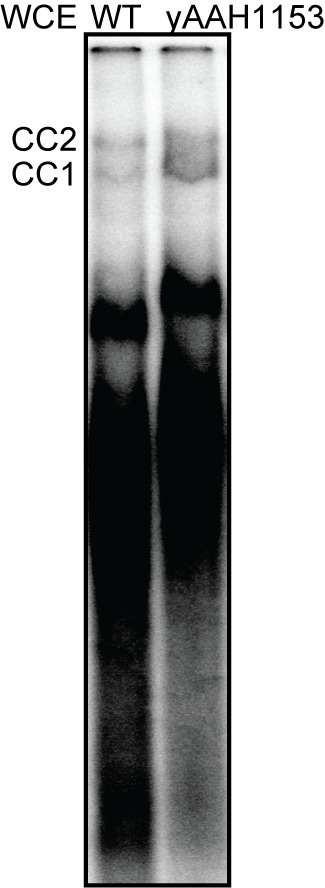
Figure 3—figure supplement 2.

CC1 and CC2 formation on [32P]-labeled RP51A RNA was monitored by native PAGE followed by phosphorimaging of the dried gel. Descriptions of the WT and yAAH1153 strains from which the WCE was prepared can be found in Supplementary file 4.
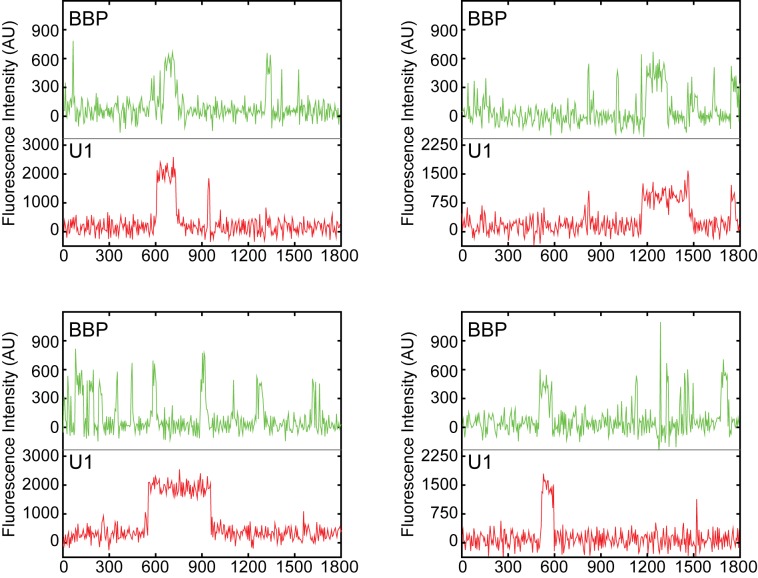
Figure 3—figure supplement 3. Examples of fluorescence intensity traces supplementing data shown in Figure 3B showing individual U1-DHFR subcomplexes and BBP-SNAPf co-localizing with surface-tethered RNAs.

Figure 3—figure supplement 3.

Figure 3—figure supplement 4. Randomized control for analysis of U1 lifetimes during colocalization with BBP to complement Figure 3D.
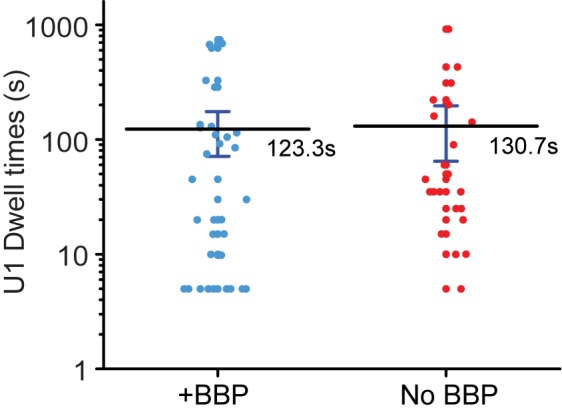
Figure 3—figure supplement 4.

U1 and BBP fluorescence intensity traces were randomly paired with one another and U1 dwell times with and without a coincident BBP binding event were then measured and plotted. The mean lifetimes are noted ±S.E and are identical following randomization.
Figure 3—figure supplement 5. E complex lifetimes on RNAs containing or lacking the ΨBS.
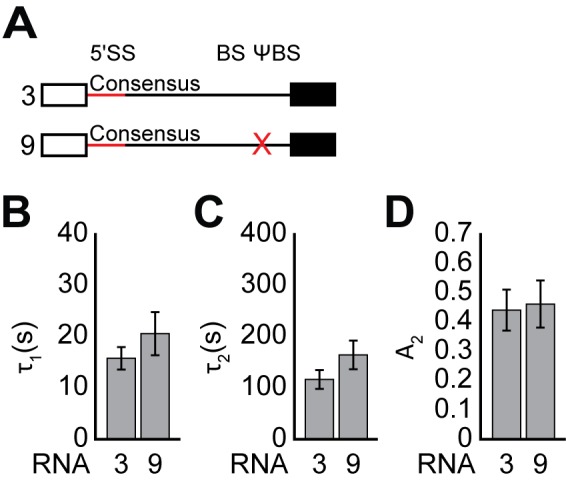
Figure 3—figure supplement 5.

(A) Graphic representation of capped RNAs with variable ΨBS used in these experiments and their corresponding label number. RNA sequences are given in Supplementary file 1. (B–D) Bar graph comparison of the fit parameters (τ1, panel B; τ2, panel C; the τ2 amplitude A2, panel D) obtained from analysis of E complex lifetimes on RNAs 3 and 9. Details of the fit parameters for data shown in (B–D) can be found in Supplementary file 5, and bars in (C–E) represent the fit parameters ± S.D.
Figure 3—figure supplement 6. Pathways for E complex formation.
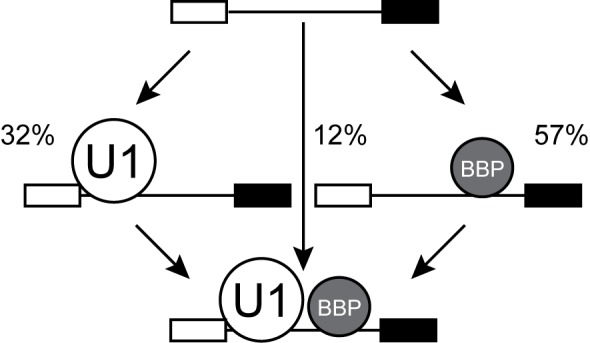
Figure 3—figure supplement 6.

In WCE, E complex can form either by U1 or BBP first pathways (N = 92 RNAs that acquired colocalized U1 and BBP molecules).
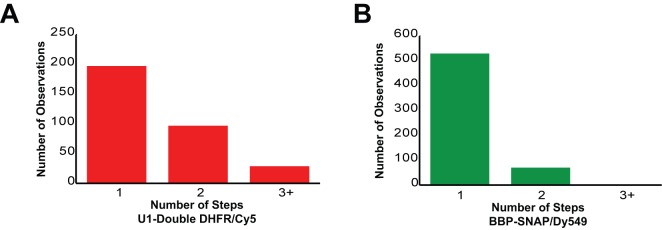
Figure 3—figure supplement 7. Counting statistics for the number of steps observed during loss of fluorescence from either U1-double DHFR or BBP-SNAPf binding events in three-color CoSMoS experiments.

Figure 3—figure supplement 7.

(A) Number of steps observed during loss of U1 fluorescence. Each U1 molecule contains two fluorophores, which can result in either 1 or two steps. 91% of U1 binding events are consistent with presence of only a single U1 molecule on the pre-mRNA. (B) Number of steps observed during loss of BBP fluorescence. Each BBP molecule contains a single fluorophore. 88% of BBP binding events are consistent with presence of only a single BBP molecule on the pre-mRNA.