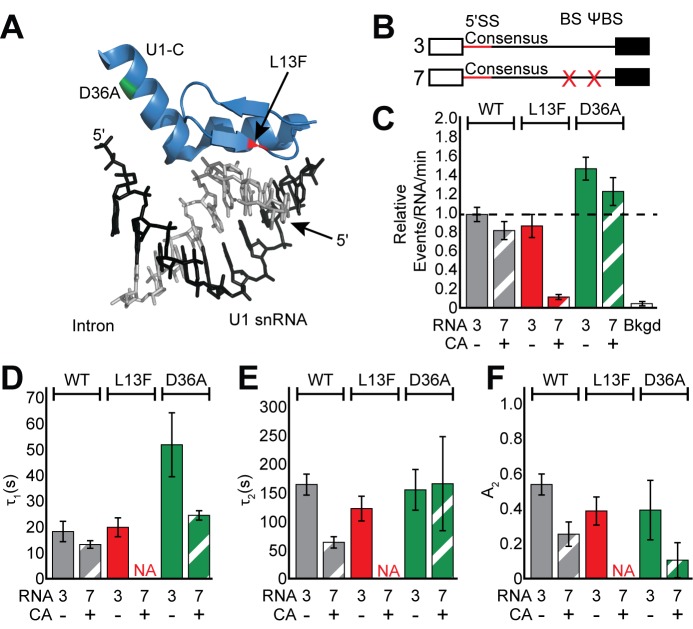
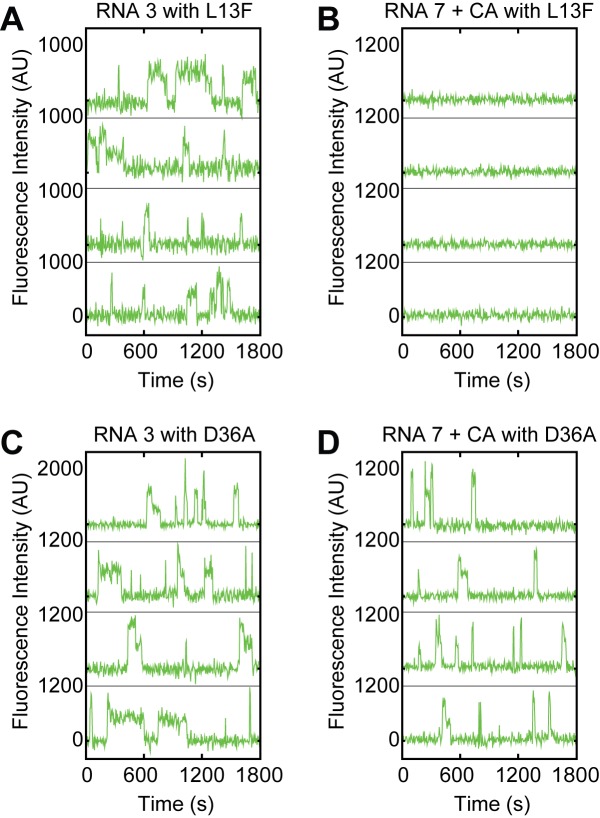
Figure 4. Impact of Yhc1 mutations on U1 binding dynamics.
(A) Close-up view of the structure of a human U1 snRNP fragment focusing on proximity of the U1 snRNA/5' SS duplex to the U1-C protein (from 4PJO.pdb). The locations of the L13F (red) and D36A (green) mutations incorporated into yeast Yhc1 are shown. (B) Graphic representation of capped RNAs with consensus 5' SS and variable BS and their corresponding label number. RNA sequences are given in Supplementary file 1. (C) Bar graph comparing the relative number of WT and Yhc1 mutant U1 binding events observed on RNAs 3 and 7 depicted in panel (B) and in the presence or absence of CA. (D–F) Bar graph comparison of the fit parameters (τ1, panel D; τ2, panel E; the τ2 amplitude A2, panel F) obtained from analysis of the dwell time distributions of WT and Yhc1 mutant U1 binding events on RNAs 3 and 7 in the presence or absence of CA. Details of the fit parameters for data shown in (D–F) can be found in Supplementary file 2. Error bars in (C) represent the error in counting statistics as given by the variance of a binomial distribution. Bars in (D–F) represent the fit parameters ± S.D. Striped bars in (C–F) indicate the addition of CA in those experiments.


