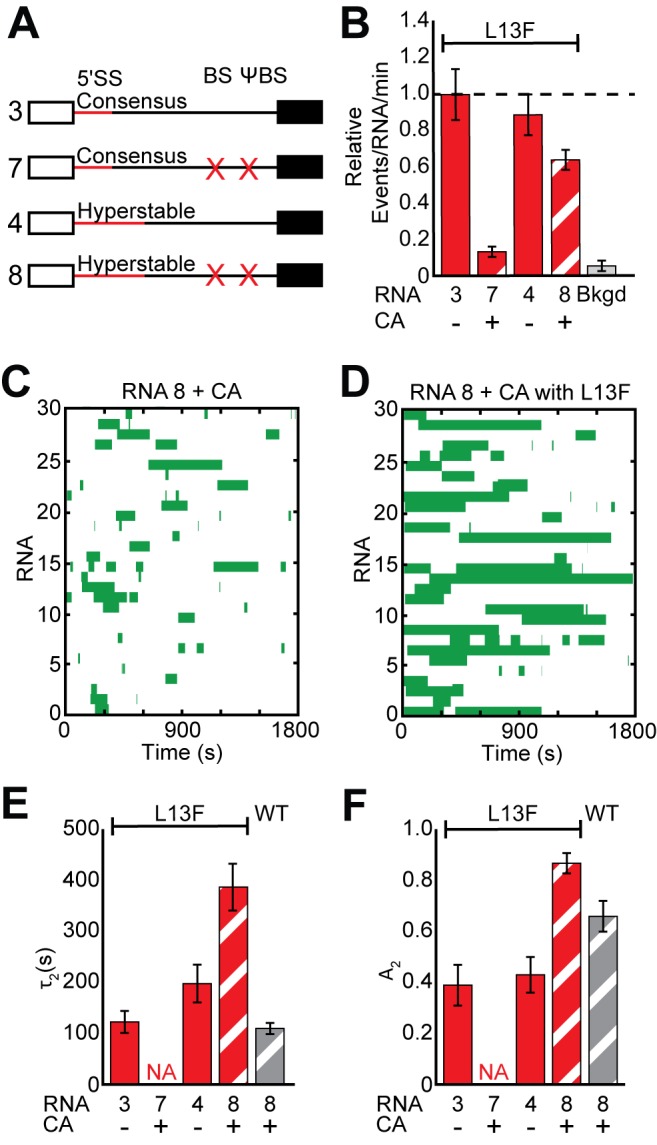
Figure 5. Impact of Yhc1 mutations on U1 binding dynamics to RNAs containing a hyperstabilized 5' SS.
(A) Graphic representation of capped RNAs with variable 5' SS and BS and their corresponding label number. RNA sequences are given in Supplementary file 1. (B) Bar graph comparing the relative number of WT and Yhc1 mutant U1 binding events observed on RNAs depicted in panel (A) and in the presence or absence of CA. (C) Rastergram depicting WT U1 binding events on RNAs containing a hyperstabilized 5' SS (RNA 8) in the presence of CA. (D) Rastergram depicting Yhc1-L13F U1 binding events on RNAs containing a hyperstabilized 5' SS (RNA 8) in the presence of CA. (E, F) Bar graph comparison of the fit parameters (τ2, panel E; the τ2 amplitude A2, panel F) obtained from analysis of the dwell time distributions of WT and Yhc1-L13F U1 binding events on RNAs shown in panel (A) in the presence or absence of CA. Details of the fit parameters for data shown in (E–F) can be found in Supplementary file 2. Error bars in (B) represent the error in counting statistics as given by the variance of a binomial distribution. Bars in (D,E) represent the fit parameters ± S.D. Striped bars in (B,E,F) indicate the addition of CA in those experiments.

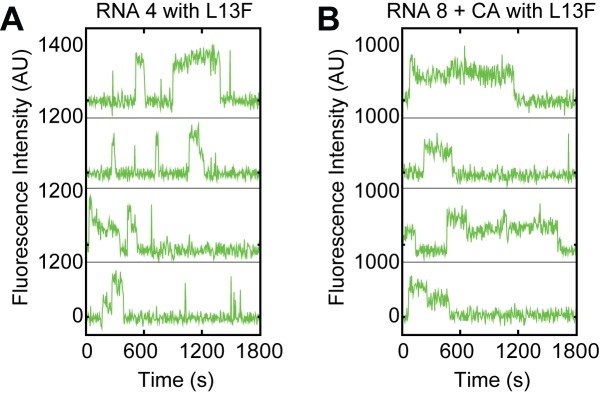
Figure 5—figure supplement 1. Examples of fluorescence intensity traces supplementing data shown in Figure 5B–F showing individual Yhc1-L13F U1-SNAPf subcomplexes co-localizing with the indicated surface-tethered RNAs in the presence or absence of CA (RNAs 4 and 8, Figure 5A).
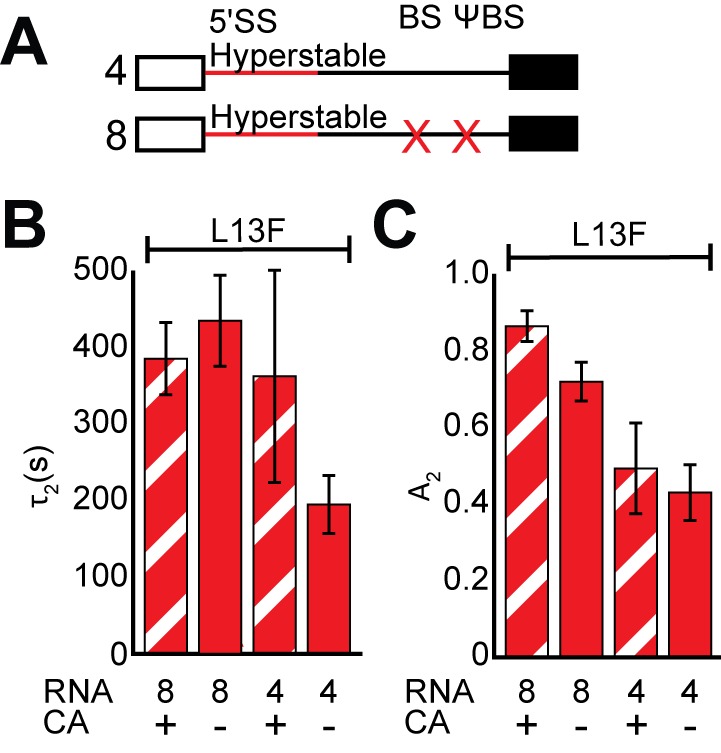
Figure 5—figure supplement 2. The BS and 5' cap work toegether to promote Yhc1-L13F release from RNAs containing hyperstabilized 5' SS.


