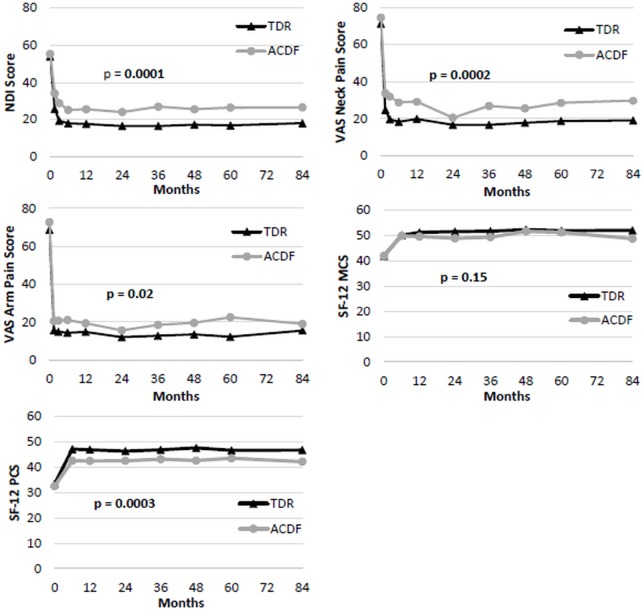
Fig. 3.
Patient-reported outcomes for two-level TDR and ACDF Patients from preoperative to 7 years follow-up. P-values are from global test of the difference between TDR and ACDF patient scores, generalized across all time points. Top Left: Mean NDI scores. Top Right: Mean VAS Neck Pain scores. Middle Left: Mean VAS arm pain scores. Middle Right: Mean SF-12 MCS. Bottom Left: Mean SF-12 PCS.

