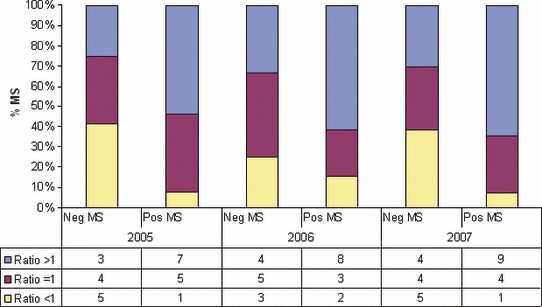
Figure 1.

Proportion of Member States (MS) with ratio holdings sampled/required sample size less than 1, equal to 1 and higher than 1, each year of surveillance. Comparing MS with negative findings versus MS with positive findings. Numbers in the table represent the number of MS with the corresponding ratio.
