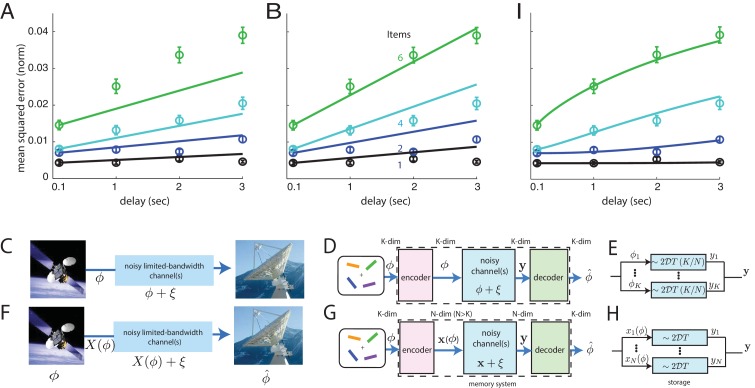
Figure 3. Comparison of direct and coded storage models using persistent activity networks with human memory performance.
(A) Lines: predictions from the direct storage model for human memory. The theory specifies all curves with a single free parameter, after shifting each curve to the measured value of performance at the shortest delay interval of 100 ms. Fits performed by weighted least squares (weights are inverse SEM). (B) Similar to (A), but parameters fit by ordinary least-squares to only the 6-item curve; note the discrepancy in the 1- and 2-item fits. (C–E) Information () is directly transmitted (or stored) in a noisy channel, and at the end an estimate of of is recovered. (C) A scenario involving space-to-earth communication. (D) The scenario for direct storage in noisy memory banks (the nosy channels); the encoder and decoder are simply the identity transformation in the case of direct storage and hence do nothing. (E) The pieces of information in the -dimensional vector are each represented in one of continuous attractor neural networks of size neurons each. Each attractor representation accumulates squared error linearly over time and inversely with . (F–H) Same as (C–E), but here information is first encoded () with appropriate structure and redundancy to combat the channel noise. A good encoder-decoder pair can return an estimate that has lower error than the direct strategy, even with similar resource use, mitigating the effects of channel noise for high-fidelity information preservation. (H) The -dimensional is encoded as the (-dimensional) codeword , each entry of which is stored in one of persistent activity networks. Squared error in the channel grows linearly with time as before; however, the resources used to build channels of quality from before are redirected into building channels of poorer quality (assuming ). The decoder estimates from -dimensional output . (I) Same as (A), but the model lines are the lower-bound on mean-squared error obtained from an information-theoretic model of memory with good coding. (Model fit by weighted least-squares; the theory specifies all curves with two free parameters, after shifting each curve to the measured value of performance at the shortest delay interval of 100 ms).


