
FIGURE 2.
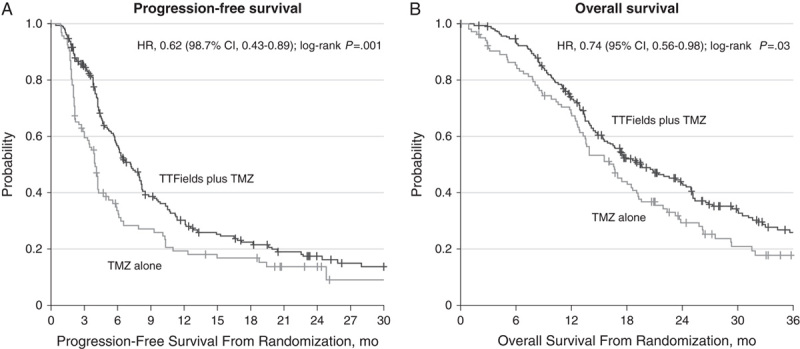
Survival curves for patients included in the interim analysis in the intent-to-treat population of EF-14. Kaplan-Meier curves for patients with GBM in the EF-14 trial, treated with TTFields/TMZ versus TMZ alone. (A) PFS (ITT) (B) OS.26 Figure adapted with permission from Stupp et al.26 GBM indicates glioblastoma; OS, overall survival; PFS, progression-free survival; TMZ, temozolomide; TTFields, tumor treating fields. Copyright © 2017 The Author(s).