
Figure 4.
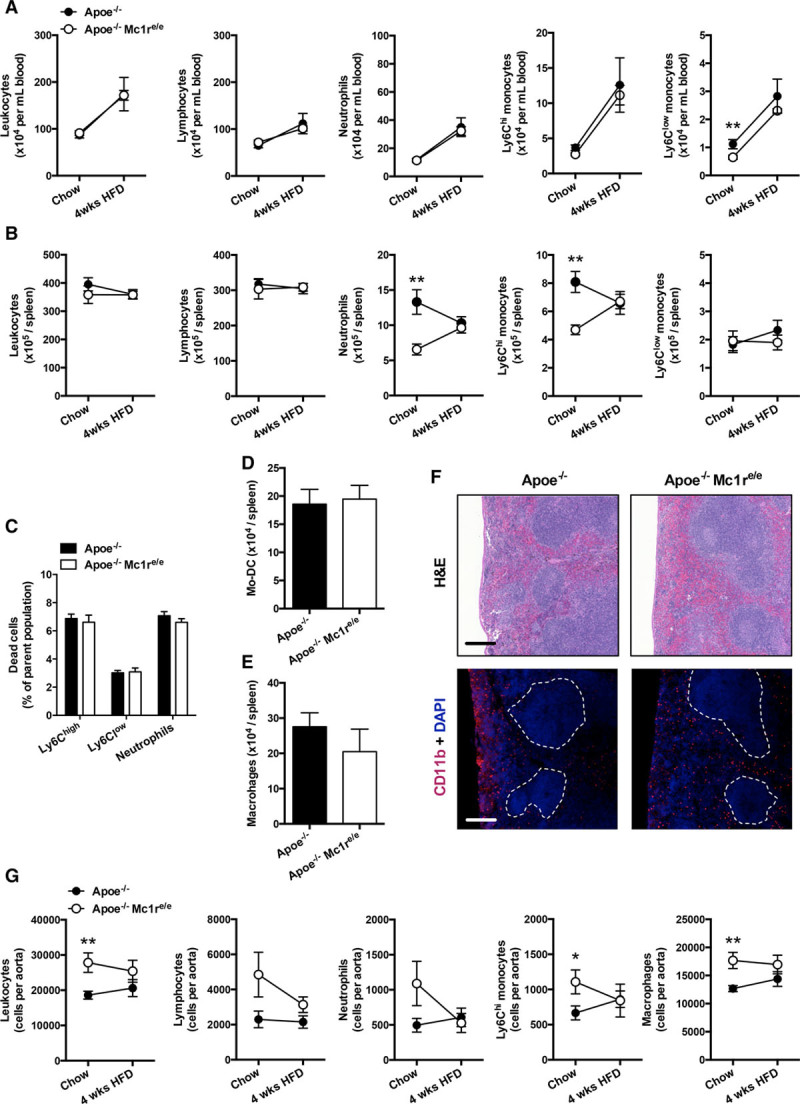
Characterization of leukocyte profiles in Apoe−/− Mc1re/e mice. A, B, Quantification of total leukocytes (CD45+), lymphocytes (CD45+, CD11b−), neutrophils (CD45+, CD11b+, Ly6G+), and Ly6Clow and Ly6Chigh monocytes (CD45+, CD11b+, CD115+, Ly6Clow/high) in the blood and spleen of Apoe−/− and Apoe−/− Mc1re/e mice. C, Percentage of dead monocytes and neutrophils in the spleen of chow-fed mice. D, E, Number of monocyte-derived dendritic cells (CD45+, CD11b+, CD11c+) and macrophages (CD45+, CD11b+, F4/80high) in the spleen of chow-fed mice. F, Representative hematoxylin and eosin (H&E)–stained and CD11b-stained spleen sections from chow-fed Apoe−/− and Apoe−/− Mc1re/e mice. Dashed lines indicate the areas of white pulps. Scale bar, 200 μm. G, Enumeration of total leukocytes, lymphocytes, neutrophils, Ly6Chigh monocytes, and macrophages (CD45+, CD11b+, F4/80high) in the aortic lysates from Apoe−/− and Apoe−/− Mc1re/e mice. n=6 to 10 mice per group in each graph. Samples for chow and 4-wk high-fat diet (HFD) groups were derived from different sets of mice. *P<0.05 and **P<0.01 vs Apoe−/− mice. Values are mean±SEM. Apoe indicates apolipoprotein; and MC1-R, melanocortin 1 receptor.