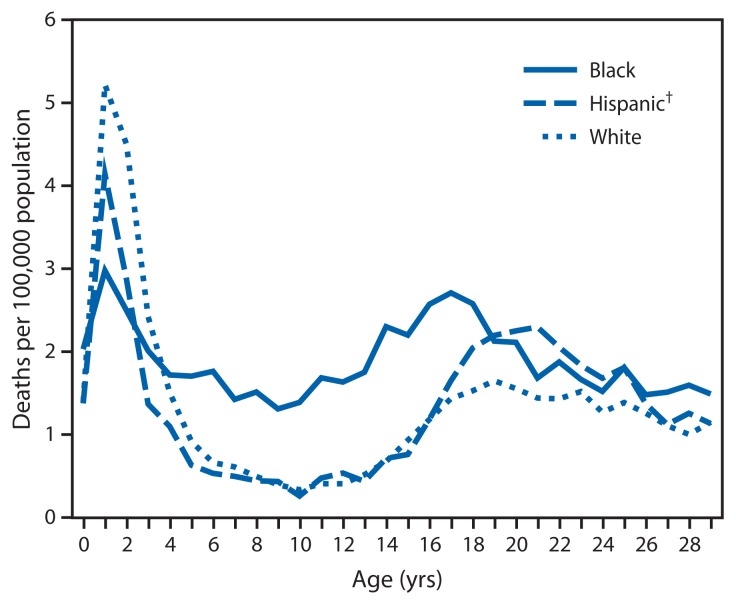
FIGURE 1.
Rates of fatal unintentional drowning among persons aged ≤29 years, by age and race/ethnicity* — United States, 1999–2010
* Rates for other racial/ethnic groups are excluded because rates are not stable for single year of age.
† Persons identified as Hispanic might be of any race. Persons identified as white or black are all non-Hispanic.

