
Figure 2.
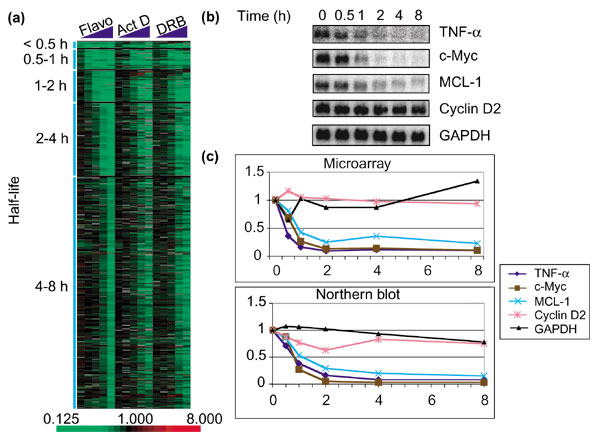
Similar gene expression patterns of OCI-Ly3 cells treated with flavopiridol, actinomycin D and DRB. (a) OCI-Ly3 cells were treated with flavopiridol (1 μM), actinomycin D (10 μg/ml), or DRB (100 μM) for 0.5, 1, 2, 4 and 8 h. These concentrations were chosen to give roughly equivalent (approximately 50%) cytotoxicity at 24 h without significant loss of cell viability at 8 h. The treated samples were labeled red (Cy5) and untreated samples were labeled green (Cy3). Genes were categorized according to their half-lives by the scheme as described in Materials and methods. (b) Northern blot analysis of selected genes. (c) Comparison of turnover rate of selected genes from microarray data and Northern blot analysis (percentage of control versus time).