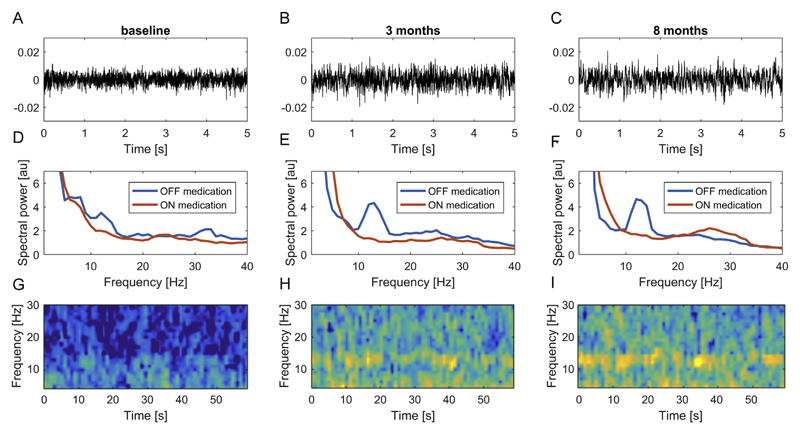
Fig. 1.
Representative example of subthalamic resting LFP data. Raw LFP data in the dopaminergic OFF condition from the right contact pair 12 in case 2 are shown for baseline (A), 3 months (B) and 8 months (C) conditions. The middle row (D-F) shows the resulting power spectra including the ON medication condition. Note that oscillatory activity can be visually identified in the time frequency representations (G-I) for OFF recordings, most notably at 3 (H) and 8 months (I).

