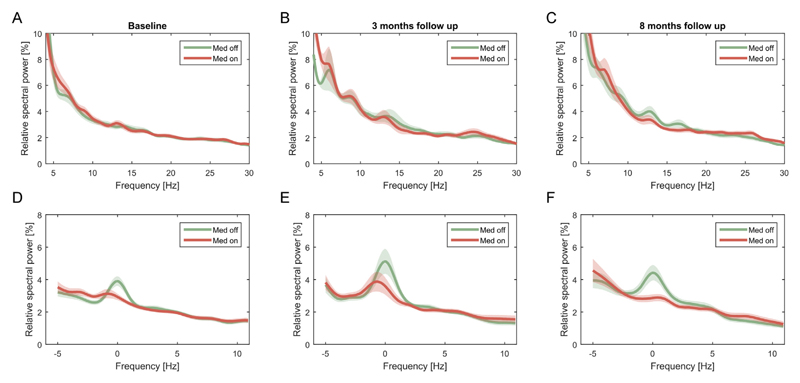
Fig. 2.
Average and peak aligned spectra for all three time points ON and OFF medication. Averaged power spectra failed to reveal distinct peaks at all time points (A–C), but clear peaks could be visualized in the medication OFF condition, when spectra were aligned to the peak centres (labelled 0 Hz) before averaging (D–F). Shaded areas depict S. E.M. across subjects.

