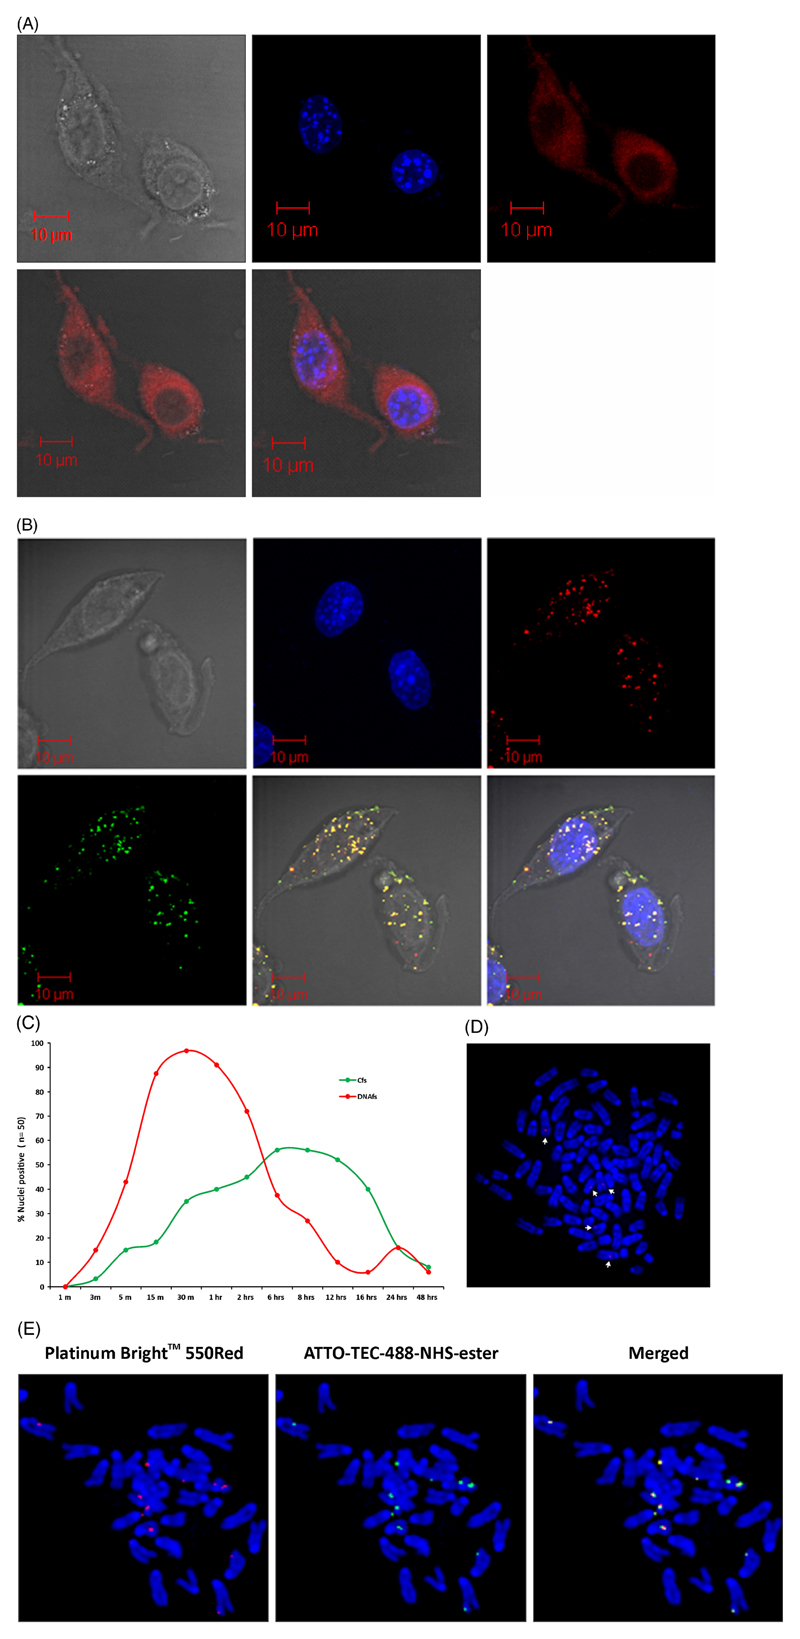
Figure 1.
Cellular entry, nuclear uptake and chromosomal association of fluorescently labelled DNAfs and Cfs. NIH3T3 cells (10×104) were treated with DNAfs labelled with ULS (red) and Cfs dual-labelled with ULS (red) and ATTO-TEC (green) (10 ng DNA in all experiments). (A) Intracellular fate of DNAfs at 30 min as analysed by LSCM. Numerous fine fluorescent particles are seen in the cytoplasm and in the nucleus. DIC, DAPI and ULS pictures are represented in different panels. (B) Intracellular fate of Cfs at 6 h as analysed by LSCM. Presence of dual-labelled Cfs in the cytoplasm and nuclei are clearly seen. The red and green signals appear yellow in colour when the images are overlapped. (C) Kinetics of nuclear uptake of fluorescently labelled DNAfs and Cfs analysed by LSCM. Fifty nuclei were analysed at each time-point and the percentage of positive nuclei was recorded. Nuclei containing at least two fluorescent spots were considered as positive. (D and E) Association of fluorescently labelled DNAfs (D) and Cfs (E) with chromosomes of treated cells. NIH3T3 cells were treated with labelled DNAfs and Cfs and metaphase spreads were prepared 6 h after treatment and analysed by fluorescence microscopy. Note that the labelled DNA particles are considerably smaller in size than Cfs particles.

