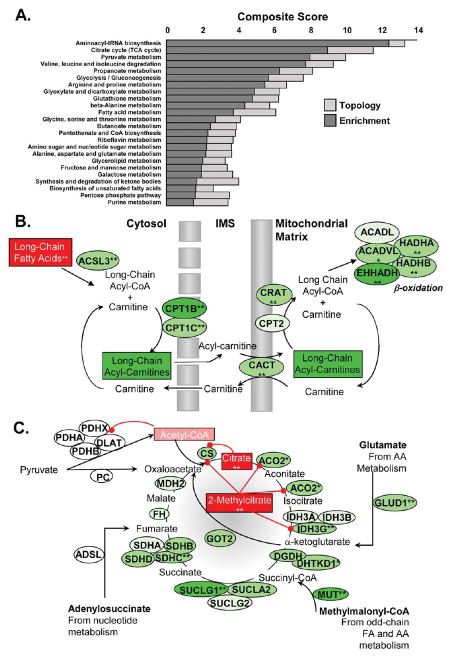
Figure 10.
Integration of the proteome and metabolome. (A) Combined GSEA/MSEA analysis of protein (mapped to the gene) and metabolite ratios in HF relative to sham. Dark gray bars indicate relative fold enrichment, and light gray bars indicate the impact of pathway topology. The composite score is simply the sum of the enrichment score (−log(p value)) and the topology score. (B) Schematic representation of proteins and metabolites underlying the fatty acid metabolism pathway. Squares denote metabolites, and ovals indicate gene names of proteins implicated in HF. Red indicates upregulation, and green denotes downregulation. The combined data suggest a bottleneck immediately prior to mitochondrial fatty-acylcarnitine import. (C) Schematic representation of proteins and metabolites of the citrate (TCA) cycle. ** denotes p < 0.05, and * denotes p < 0.075. The combined protein and metabolite data imply TCA cycle flux and/or anaplerosis may be inhibited in guinea pig HF.

