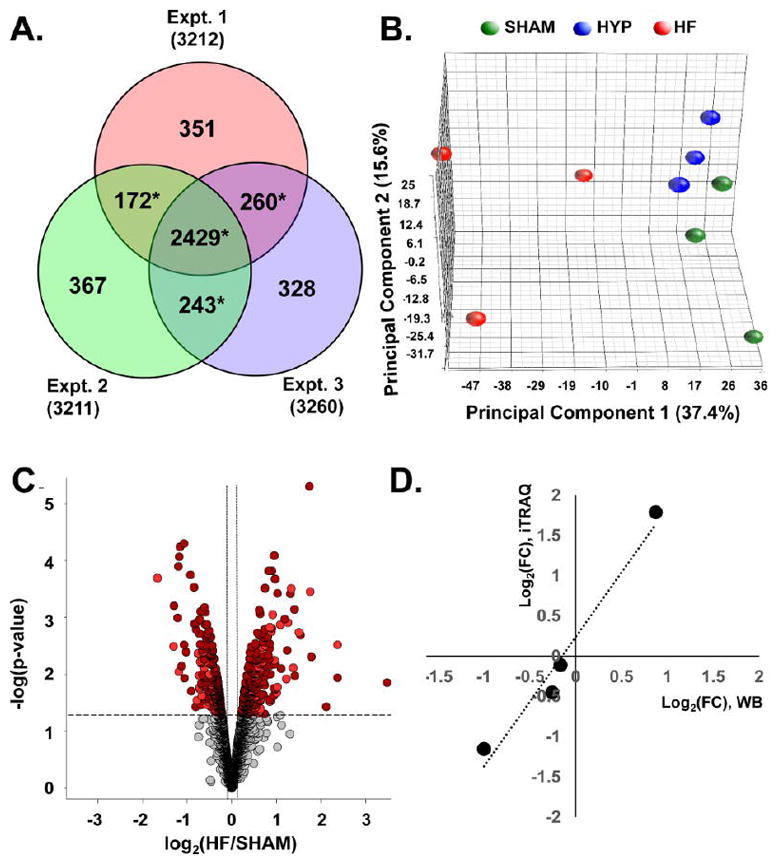
Figure 2.

Quantitative proteomic data set. (A) Venn analysis of protein identification across three independent iTRAQ experiments. Data-dependent sampling of peptides for MS2 spectral acquisition yielded distinct but overlapping proteomes. Empirical Bayesian statistical methods can accommodate sampling-related absence and, therefore, analysis of relative abundance, provided that the protein is observed in two or more independent experiments (denoted with *). (B) Principal component analysis of protein abundances across the data set. Component 1 differentiates distinct global protein abundance biosignatures of sham, HYP, and HF hearts. (C) Volcano plot providing a visual representation of differential protein regulation in HF, for which a detailed table is found in panel 2 in the Supporting Information. Dark-red circles represent significantly regulated (p < 0.05) proteins identified in all three experiments. Light-red circles denote those identified in two out of three experiments. The use of EB-modified p values obviates arbitrary fold-change thresholds that undermine FDR assessment. (D) Corroboration of fold changes (FCs) determined by mass spectrometry with those determined by immunoblot analysis.
