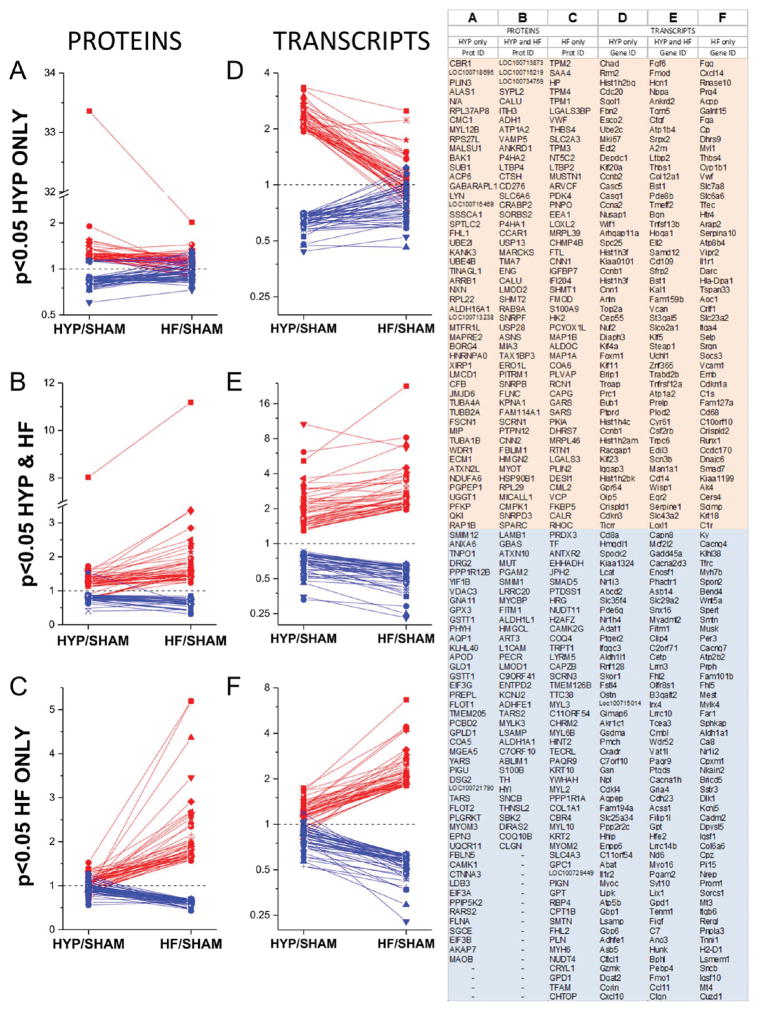
Figure 3.
Top regulated proteins and transcripts. The proteome (A–C) and the transcriptome (D–F) were parsed into three categories, those regulated (p < 0.05) in HYP only, in HYP and HF, and in HF only. Red symbols and traces denote entities upregulated in the specified condition. Blue symbols and traces denote entities that are downregulated in the specified condition. Transcripts and proteins were mapped to their respective genes, and the top genes in each category are listed in the right-hand panel.

