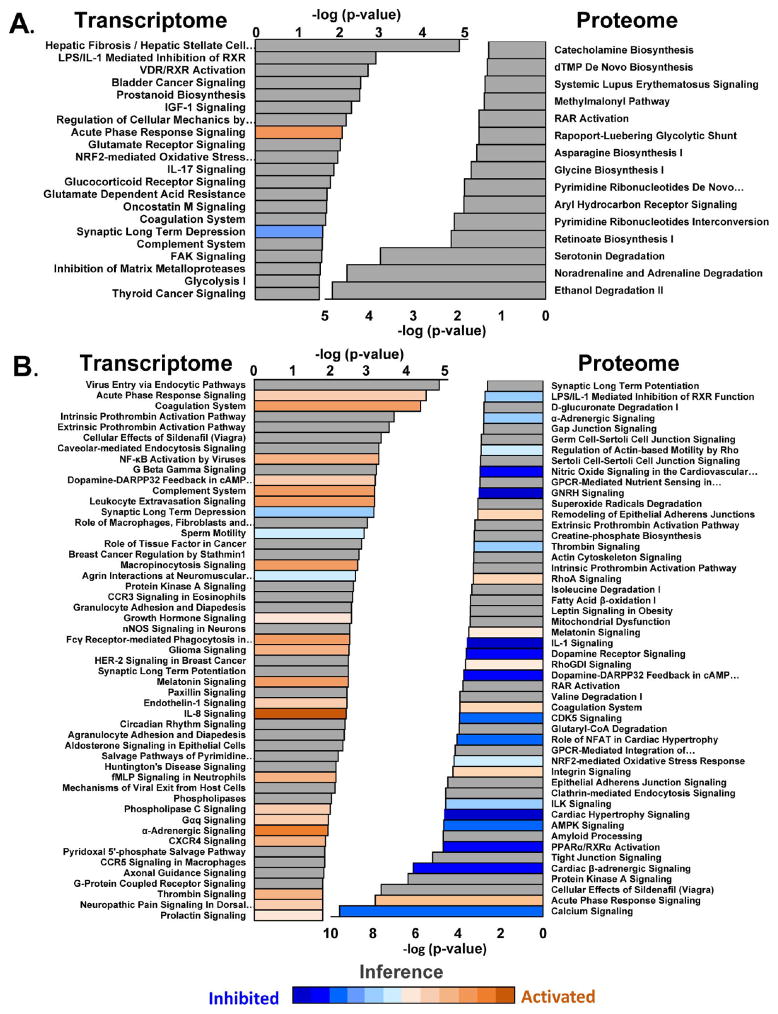
Figure 4.
Pathway analysis. (A) Pathway analysis of transcripts and proteins significantly regulated in both HYP and HF. (B) Analysis of transcripts and proteins significantly regulated in HF only. Where sufficient information exists, pathways are colored according to inferred activation or inhibition on the basis of their z scores (see the Supporting Information). Warm colors (orange, brown) denote inferred pathway activation. Cool colors (blue shades) denote inferred pathway inhibition.

