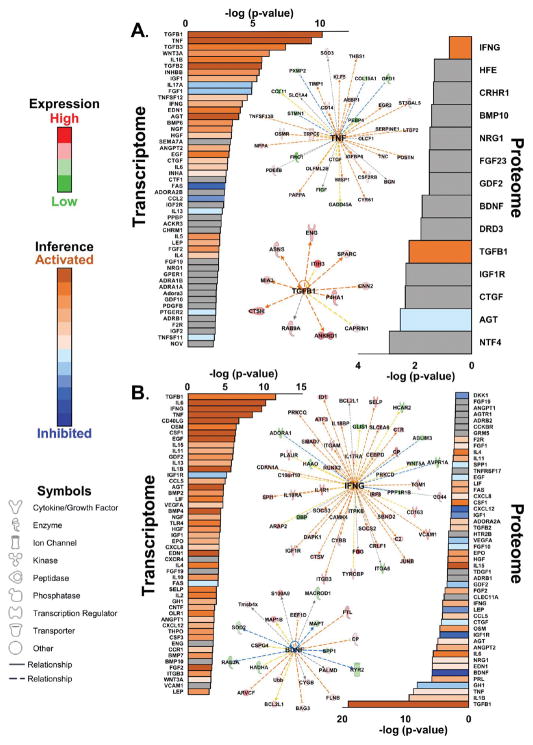
Figure 5.
Upstream signaling. (A) Upstream signaling analysis of transcripts and proteins significantly regulated in both HYP and HF. Exemplar signaling networks are shown. The TNF network was inferred from the transcriptome, whereas the TGFB1 network was inferred from the proteome. (B) Analysis of transcripts and proteins significantly regulated in HF only. The INFG network was inferred from the proteome and the BDNF network was inferred from the proteome. Where sufficient information exists, pathways are colored according to inferred activation or inhibition on the basis of their z scores (see the Supporting Information). The peripheral nodes represent the HF/sham ratios from the Supporting Information. The colors of the peripheral nodes are given by the red/green spectrum, where red denotes upregulation and green denotes downregulation. The central node indicates the inferred upstream signal that would explain the ratios represented in the peripheral nodes. The dotted lines linking the central node to the peripheral nodes indicate indirect relationships between the signal and the ultimate transcript or protein ratios. The colors of the dotted lines indicate inferred activation or inhibition of signaling. Yellow dotted lines indicate a transcript or protein ratio at odds with the predicted effect of signaling.

