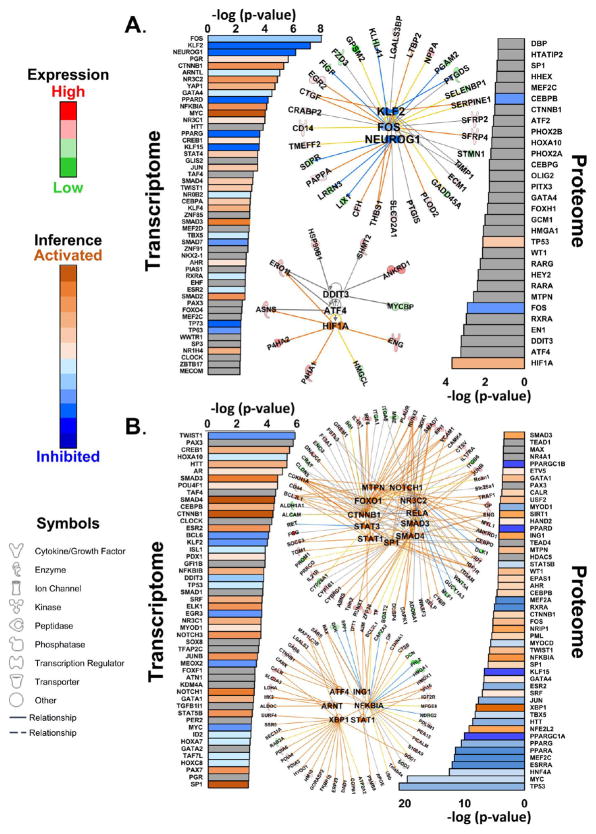
Figure 6.
Upstream transcriptional programs. (A) Upstream transcriptional program analysis of transcripts and proteins significantly regulated in both HYP and HF. The top three programs in the transcriptome (according to log(p value)), KLF2, FOS, and NEUROG1, are shown as a network. The top three transcriptional programs inferred from proteomic data are HIF1A, ATF4, and DDIT3. (B) Transcriptional programs inferred from transcripts and proteins significantly regulated in HF only. Where sufficient information exists, pathways are colored according to inferred activation or inhibition on the basis of their z scores (see the Supporting Information). The top 11 activated transcriptional programs (from z scores) based on transcriptome data are shown to illustrate the degree of redundancy between programs. The top six activated programs based on the proteome are shown. It should be noted that the cases of ING1 and NFKB1A illustrate how activation of the program is consistent with repression of downregulation of the protein (blue lines). The network specifications are the same as in Figure 5, with the exception that the solid lines between the central and peripheral nodes indicate direct regulatory relationships.

