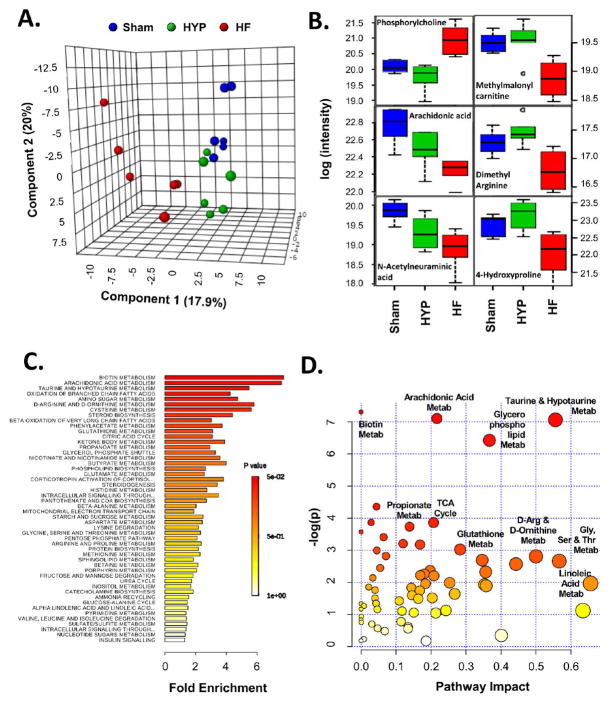
Figure 9.
Characterization of the metabolome in HYP and HF. (A) Partial least-squares discriminant analysis reveals the distinctive nature of the metabolome in HF. The metabolome in HYP was less differentiated relative to the sham group. (B) Box plots representing the metabolite trajectories in HYP and HF, including metabolites up- or downregulated in HF only and metabolites progressively downregulated in HYP and HF. (C) Metabolite set enrichment analysis (MSEA) of metabolite regulation in HF. The x axis shows fold enrichment, and the color spectrum represents the span of Holm’s FWER-corrected p values. (D) Metabolite pathway analysis (MetPA) incorporating MSEA (y axis) and pathway topology (x axis). The size of the circles is proportional to the number of compounds identified in a given pathway, and the color reffects the Holm’s FWER-corrected p value. Selected pathways are highlighted. The entire set of pathways identified by MSEA and MetPA can be found in panels 23 and 24 in the Supporting Information.

