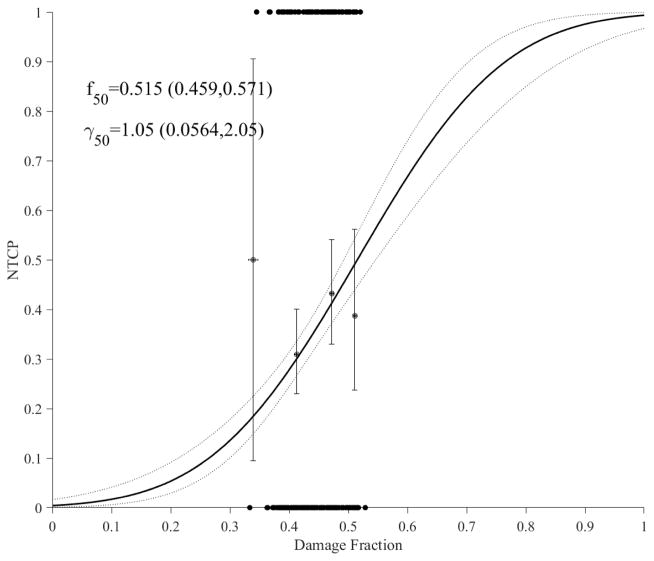
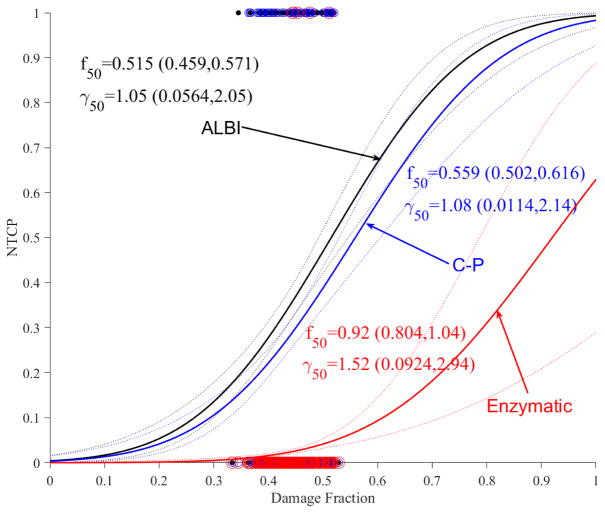
Figure 3.
Accumulative functional reserve NTCP PA model using portal venous perfusion. (a) ALBI changes with dots representing the original data (black). (b) ALBLI along with C-P (blue) and liver enzymatic changes (red) with circles representing the original data. The solid lines represent the optimal fits and the dotted lines represent the 95% confidence band.


