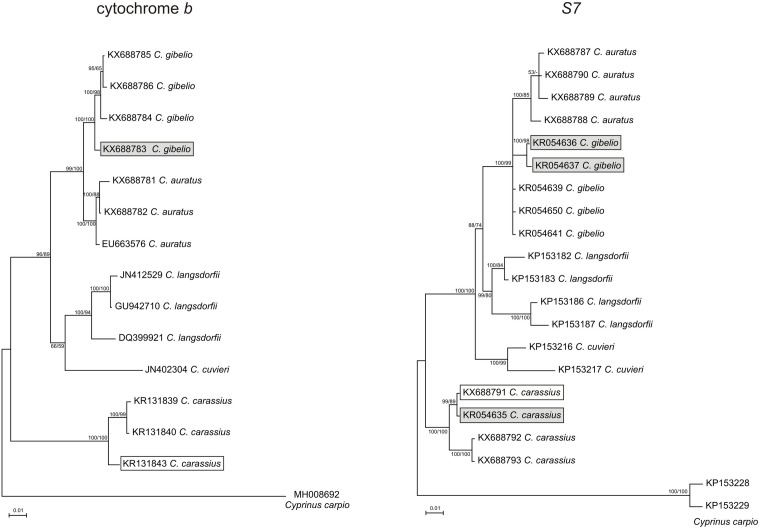
Fig 2. Reconstructed Carassius phylogeny of the mitochondrial cyt b and nuclear S7 sequences.
Topologies of phylogenetic trees follow BAY analysis graphical outline. Numbers at the nodes represent statistical support for BAY and MP analyses, respectively. Bootstrap supports below 50 and Bayesian posterior probabilities below 0.75 are not shown. Sequences of the analysed individuals: hybrid female (CCAHe1Fi) and male (CCAHe2Fi) are highlighted by the grey and white rectangles, respectively.

