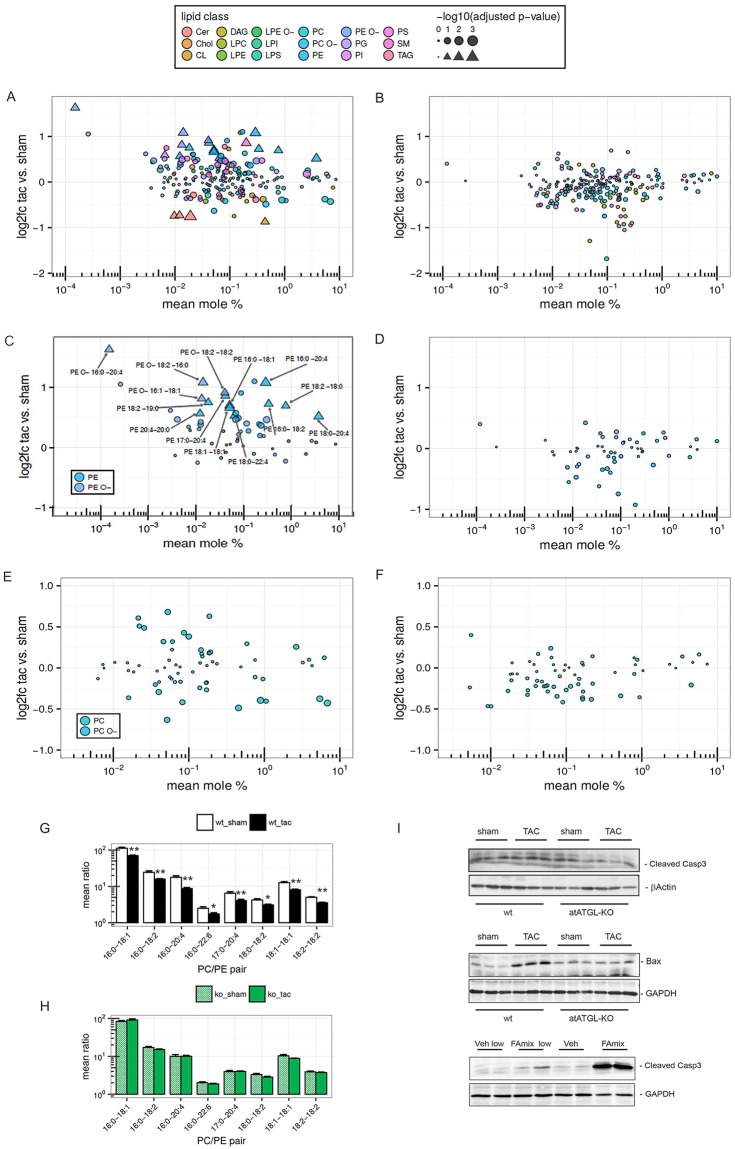
Fig 4. Induction of pressure-mediated cardiac PE species is attenuated in atATGL-KO mice.
MS-based shotgun lipidomics analysis of heart tissue samples (LV) isolated 11 weeks after intervention (sham or TAC) from wild-type (wt) or atATGL-KO mice. Lipid class denotations see Fig 3. A-F: Mean log2-fold change (TAC vs. sham) vs. mean mole percent of lipid species. Triangles represent significantly changed lipid species (FDR adjusted p-value < 0.1 and absolute value of log2-fold change ≥ 0.5); bubbles represent those which are not significantly changed; size indicates log-transformed adjusted p-values. A, C, E: wt-mice. B, D, F: atATGL-KO-mice. G+H: Significantly changed PC-PE ratios of matched FAs in wt-mice (G) or atATGL-KO mice (H). The mean ratio ± SEM is shown on a logarithmic scale, Mann-Whitney U test for TAC vs. sham: *p<0.05, **p<0.01 (adjusted) in wt-mice, no significant changes were found in at ATGL-KO mice. I: upper panels: WB analysis of heart lysates using antibodies against cleaved caspase 3 and Bcl-associated X protein (Bax); lower panel: WB analysis of HL-1 cardiomyocytes lysates from cells stimulated with vehicle (Veh) or fatty acid (FA) mix (C16:0, C18:1,C18:2 in different concentrations) using antibodies against cleaved caspase 3; loading control: β–actin, glyceraldehyde 3-phosphate dehydrogenase (GAPDH).

