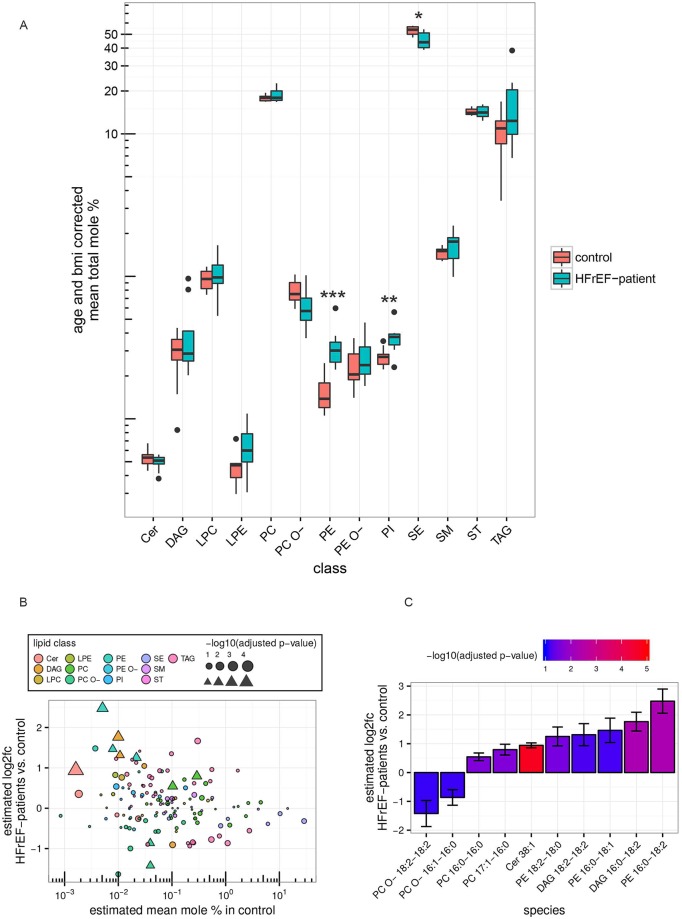
Fig 5. Selected lipid species are altered in plasma samples from patients with HFrEF MS-based shotgun lipidomics analysis of human plasma samples from HFrEF-patients (n = 13) and non-HFrEF controls (n = 10).
A: Box plots show distribution of total mole percent values for each lipid class corrected for age and BMI (see supplementary methods). To test for differential changes a Mann-Whitney U test between HFrEF-patients and controls was performed. Adjusted p-values are indicated: *p<0.05, **p<0.01, **p<0.001. B: Estimated mean log2 fold change (HFrEF vs. control) vs. estimated mean mole percent of lipid species in the control group (see supplementary methods). Triangles represent significantly changed lipid species (FDR adjusted p-value < 0.1 and absolute value of log2-fold change ≥ 0.5), bubbles show those which are not significantly changed, size indicates log-transformed adjusted p-values. C: Bar graph shows the estimated log2-fold change (HFrEF vs. control) ± regression standard error of differentially changed lipid species (see B.). Colors represent log10 adjusted p-values as indicated. Lipid classes: Cer: ceramide, DAG: diacylglycerol, LPC: lyso-phosphatidylcholine, LPE: lyso-phosphatidylethanolamine, PC: phosphatidylcholine, PC O-: phosphatidylcholine-ether, PE: phosphatidylethanolamine, PE O-: phosphatidylethanolamine-ether, PI: phosphatidylinositol, SE: sterol ester, SM: sphingomyelin, ST: sterols, TAG: triacylglycerol.

