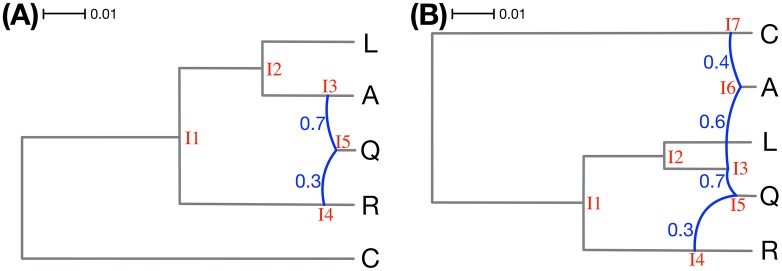
Fig 3. The two model phylogenetic networks used to generate the simulated data sets.
The branch lengths of the phylogenetic networks are measured in units of expected number of mutations per site (scale is shown). The inheritance probabilities are marked in blue. Both networks are based on the same “backbone” tree: Removing the R→Q reticulation edge in (A) and the C→A and R→Q reticulation edges in (B) gives rise to the tree (C,(R,(L,(A,Q)))). The hybridization events in the panel can be viewed as involving pairs of branches of this tree: (A) The hybridization is from R to Q. (B) One hybridization is from R to Q and another is from C to A.

