
Figure 3.
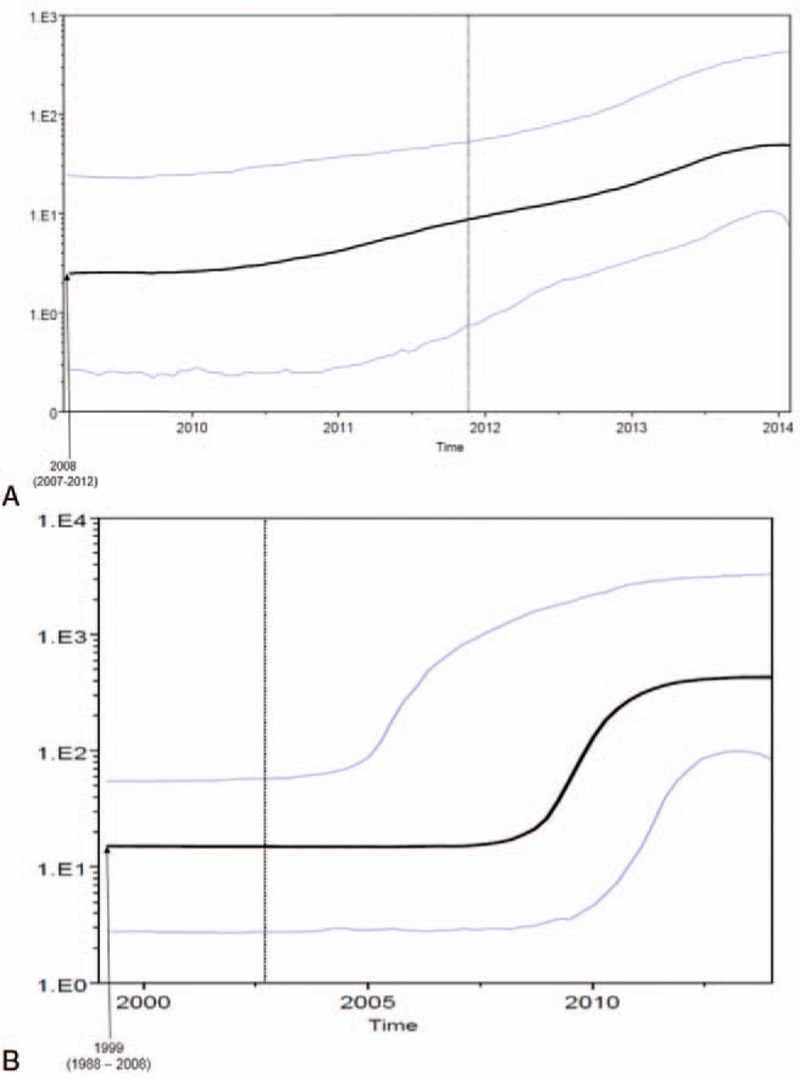
Demographic history of Bulgarian HAV genotype I (subtype Ib: panel a; subtype Ia: panel b). The demographic history was inferred by a nonparametric Bayesian skyline plot (BSP). The y-axis reports virus effective population size (Ne), a measure of genetic diversity representing the number of genomes effectively contributing to new infections, while the x-axis is time in calendar years. Black lines are median estimates; purple lines are 95% highest posterior density intervals. BSP = Bayesian skyline plot, HAV = hepatitis A virus.