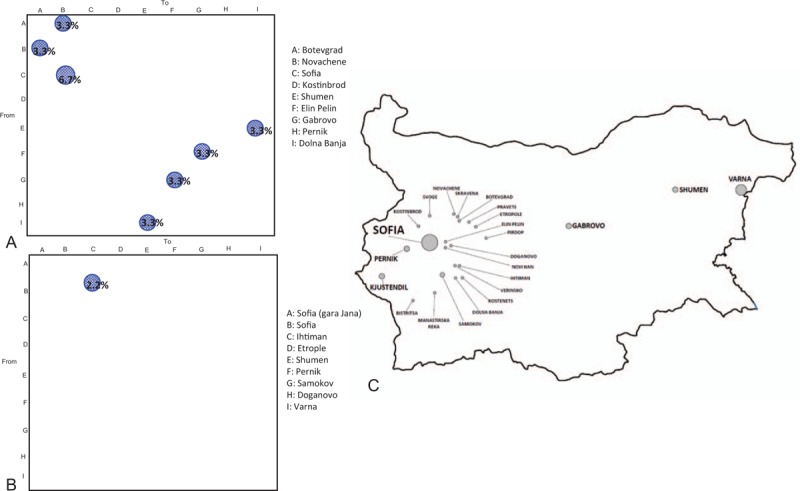
Figure 6.

Migration pattern of HAV genotype I circulation in Bulgaria. The bubblegram shows the frequency of gene flow (migrations) in Bulgaria to/from different geographic areas (towns). The surface of each circle is proportional to the percentage of observed migrations. Migrations were inferred with a modified version of the Slatkin and Maddison algorithm. (Panel A) HAV subtype Ib (third dataset). A: Botevgrad; B: Novachene; C: Sofia; D: Kostinbrod; E: Shumen; F: Elin Pelin; G: Gabrovo; H: Pernik; I: Dolna Banja. (Panel B) subtype Ia (fifth dataset). A: Sofia (Gara Jana); B: Sofia; C: Ihtiman; D: Etrople; E: Shumen; F: Pernik; G: Samokov; H: Doganovo; I: Varna. (Panel C) map of Bulgaria highlighting the different area enrolled in migration patterns of HAV genotype I. HAV = hepatitis A virus.
