Figure 5.

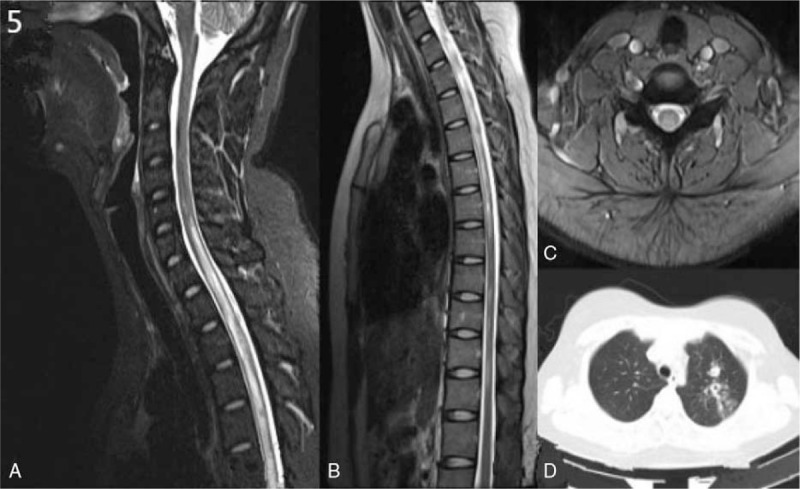
A–D, MRI scan of case 2 showed hyperintensity signal from C3 to T11 on T2-weighed images (A–C). Lung CT scan showed tuberculosis with cavitation in the left upper lobe (D). CT = computed tomography, MRI = magnetic resonance imaging.

A–D, MRI scan of case 2 showed hyperintensity signal from C3 to T11 on T2-weighed images (A–C). Lung CT scan showed tuberculosis with cavitation in the left upper lobe (D). CT = computed tomography, MRI = magnetic resonance imaging.