
Figure 1.
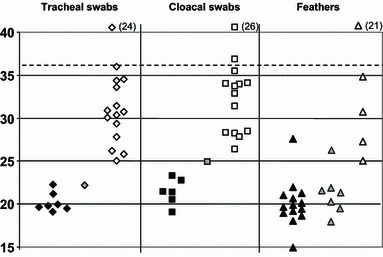
Distribution of Ct values (H5 HA2 RRT‐PCR) for chicken specimens according to lateral flow devices (LFD) results. Ct values are shown for specimens from all 46 chickens, which included tracheal swabs, cloacal swabs and feathers, indicated by diamond, square and triangle symbols respectively. All were tested by H5 HA2 RRT‐PCR and both Anigen and Quickvue LFDs. Black, grey and white fills correspond to samples that were respectively (i) positive by the RRT PCR and both LFDs, (ii) positive by the RRT PCR and the Anigen LFD but negative by the Quickvue LFD and (iii) negative by both LFDs. Parentheses adjacent to the white‐filled symbols at the head of the graph indicate the numbers of specimens that were negative by the H5 RRT PCR (‘No Ct’) and negative by both LFDs. Broken horizontal line indicates indicates positive cut‐off at Ct 36, with Ct 36·01–39·99 classed as indeterminate. RRT‐PCR, reverse transcriptase real time PCR.