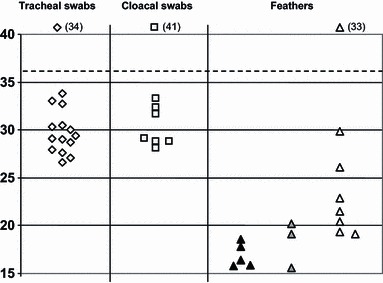
Figure 2.

Distribution of Ct values (H5 HA2 RRT PCR) for duck specimens according to lateral flow devices (LFD) results. Ct values are shown for specimens from all 48 ducks, which included tracheal swabs, cloacal swabs and feathers, indicated by diamond, square and triangle symbols respectively. Details are as explained in the footnote to Figure 1. There were no LFD positives among the duck swabs.
