
Figure 2.
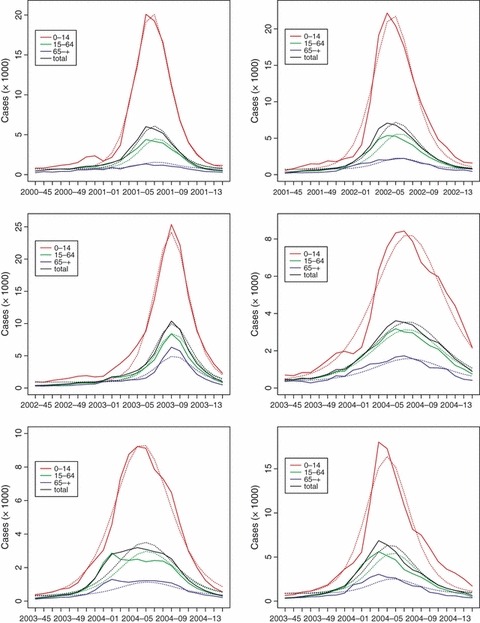
Graphical comparison between the observed influenza epidemics in Italy (dashed lines) during the analysed seasons and the epidemic curves predicted by model (1) (solid lines). Figure shows the curves for each age class (colour, coded as in the key) and for the entire population (in black).