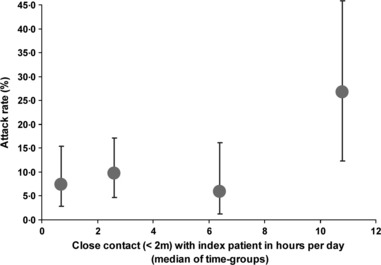
Figure 3.

Secondary attack rate (in % with 95% CI) by category of close contact time with the index patient (in hours); points on the x‐axis are plotted at the median of the participants contained in the respective intervals; pandemic season (H1N1) 2009. Time groups are defined as: 0–1; 2–5; 5–8; and 9 or more hours.
