
Figure 3.
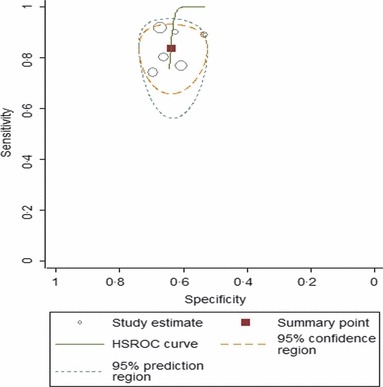
Summary receiver operating characteristic (ROC) curve. This figure shows the summary ROC (solid line), the bivariate summary estimate (solid square), and the corresponding 95% confidence ellipse (inner dashed line) and 95% prediction ellipse (outer dotted line). Symbol size for each study is proportional to the study size.