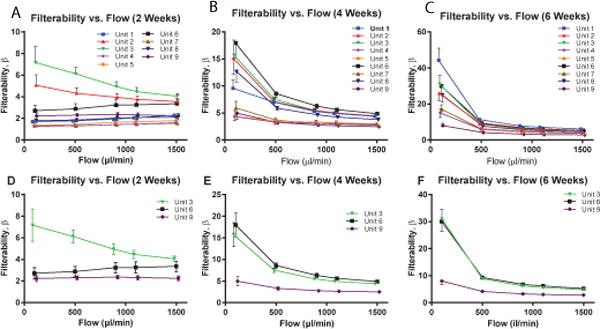
Fig. 3.

Filterability as afunction of Flow Rate at 3 Different Storage Times, as quantified by the β factor. Filterability vs. Flow Rate for 9 different units of human RBCs at (A) 2 weeks, (B) 4 weeks, and (C) 6 weeks of storage. Filterability vs. Flow Rate for the 3 different units of human RBCs with the lowest Pearson r coefficient (Units 3,6, and 9) at (D) 2 weeks, (E) 4 weeks, and (F) 6 weeks of storage.
