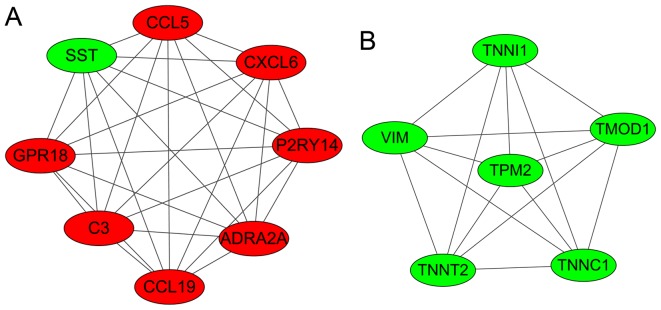
Figure 3.
Two significant clustering modules (modules A and B) that were identified in the PPI networks. The red nodes represent the upregulated genes and the green nodes represent the downregulated genes. SST, somatostatin precursor; CCL5, chemokine C-C motif ligand 5; CXCL6, chemokine C-X-C motif ligand 6; P2RY14, P2Y purinoceptor 14; ADRA2A, adrenoceptor α2A; C3, complement component 3; GPR18, G-protein-coupled receptor 18; VIM, vimentin; TNNI1, troponin I1; TMOD1, tropomodulin 1; TNNC1, troponin C1; TNNT2, troponin T2; TPM2, tropomyosin 2β.

