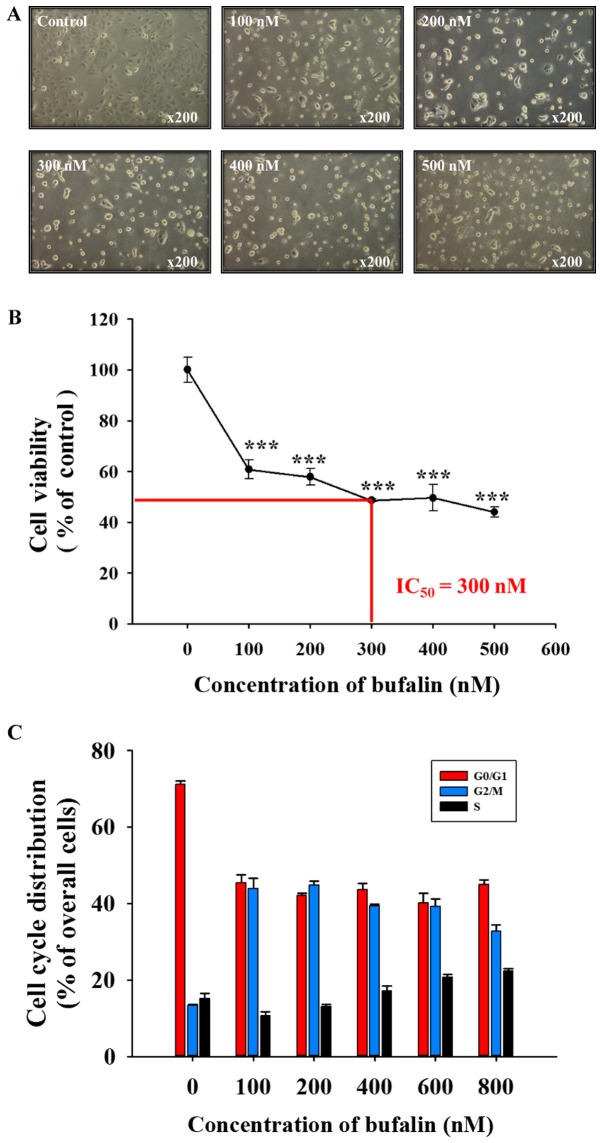
Figure 1.
Bufalin induced cell morphological changes, decreased cell viability and induced G2/M phase arrest in SCC-4 cells. (A) Cells were treated with 0, 100, 200, 300, 400 and 500 nM of bufalin for 48 h and subsequently examined and photographed for cell morphological changes by phase contrast microscopy. Magnification, ×200. Cells were harvested to analyze the (B) number of viable cells and (C) the cell cycle distribution by flow cytometry. The results are presented as the mean ± standard deviation (n=3). ***P<0.001 vs. 0 nM bufalin (control). IC50, half-maximal inhibitory concentration.

