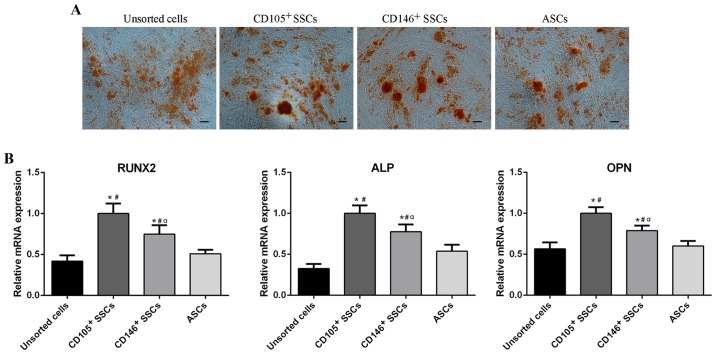
Figure 5.
Comparison of osteogenic differentiation potential. (A) Alizarin red staining of unsorted cells, CD105+ SSCs, CD146+ SSCs and ASCs. Scar bar, 100 µm. (B) The mRNA levels of Runx2, ALP and OPN were detected using reverse transcription-quantitative polymerase chain reaction. All data are from 3 independent experiments and are presented as means ± SD. *P<0.05 vs. unsorted cells; #P<0.05 vs. ASCs, αP<0.05 vs. CD105+ SSCs. RUNX2, runt-related transcription factor 2; ALP, alkaline phosphatase; OPN, osteopontin; ASCs, adipose-derived stem cells; SSCs, skeletal stem cells; CD, cluster of differentiation.

