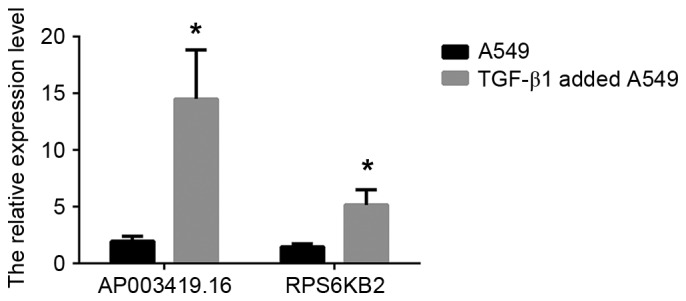
Figure 5.

Validation of AP003419.16 and RPS6KB2 data by reverse transcription-quantitative polymerase chain reaction analysis at the cellular level. The relative expression levels of AP003419.16 and RPS6KB2 were normalized and the data displayed in the histograms are expressed as the mean ± standard deviation (*P<0.05 vs. control). RPS6KB2, ribosomal protein S6 kinase B-2; TGF-β1, transforming growth factor-β1.
