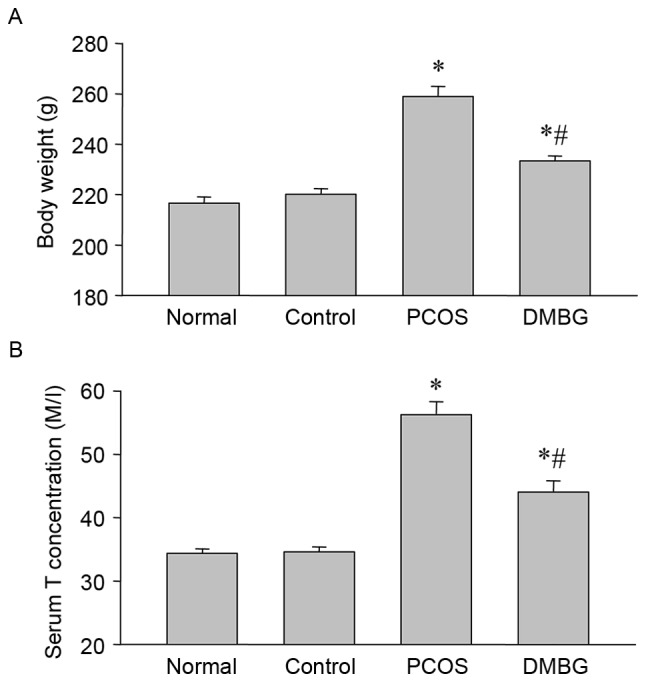
Figure 1.

Differences in body weight and serum testosterone levels. (A) Differences in body weight among groups were examined at the end of experiments (B) Serum testosterone concentrations were detected by ELISA in each group. Data are presented as the mean ± standard error of the mean. *P<0.05 vs. blank control group; #P<0.05 vs. PCOS group. PCOS, polycystic ovary syndrome; DMBG, dimethyldiguanide; T, testosterone.
