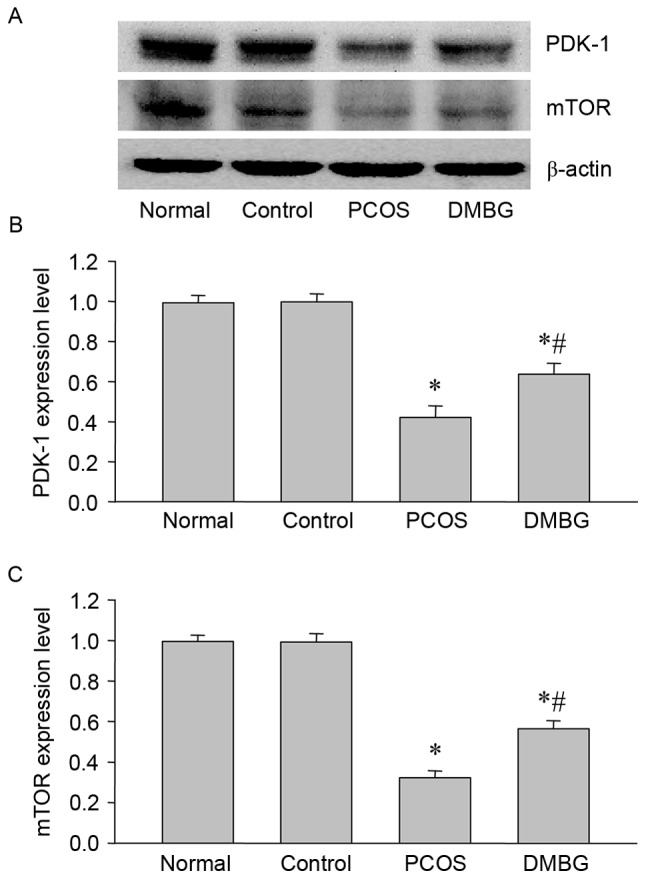
Figure 6.

Western blot analysis of PDK-1 and mTOR protein expressions in the ovaries of each group. (A) Representative western blot demonstrating the protein expression of PDK-1 and mTOR. Quantified levels of (B) PDK-1 and (C) mTOR protein normalized to the blank control. Data are presented as the mean ± standard error of the mean, n=6. *P<0.05 vs. blank control group; #P<0.05 vs. PCOS group. PDK-1, phosphoinositide-dependent kinase-1; mTOR, mammalian target of rapamycin; PCOS, polycystic ovary syndrome; DMBG, dimethyldiguanide.
