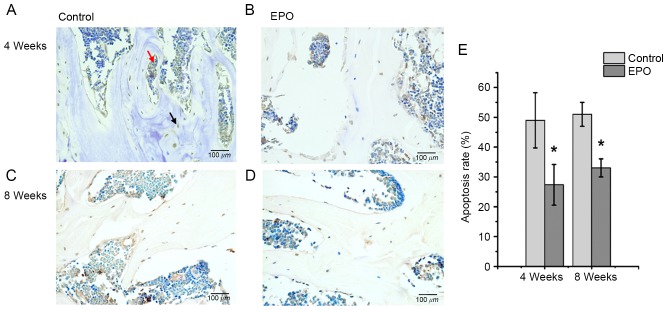
Figure 5.
Terminal deoxynucleotidyl-transferase-mediated dUTP nick end labeling assays of femoral heads. The (A) control and (B) EPO groups at 4 weeks; the (C) control and (D) EPO groups at 8 weeks. At 4 and 8 weeks following treatment with EPO, less apoptotic cells were present in the trabecular bone and bone marrow cavity of the EPO group compared with the control group. The black arrow indicates an apoptotic cell in the trabecular bone and the red arrow indicates apoptotic cells in the bone marrow cavity. (E) Quantitative analysis of the apoptosis rate in the control and EPO treatment group at 4 and 8 weeks. A significantly higher apoptosis rate was observed in the control group compared with the EPO treatment group at 4 and 8 weeks. Data were presented as the mean ± standard deviation. *P<0.05 vs. the control group. EPO, erythropoietin.

