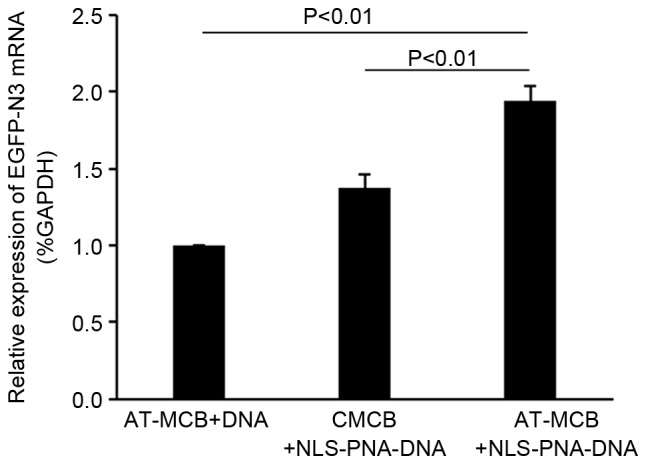
Figure 5.

mRNA expression levels of EGFP-N3, as assessed using reverse transcription-polymerase chain reaction. Data are expressed as the mean ± standard deviation. EGFP, enhanced green fluorescent protein; CMCB, ordinary microbubbles; AT-MCB, antibody targeted microbubbles; NLS, nuclear localization signal; PNA, peptide nucleic acid.
