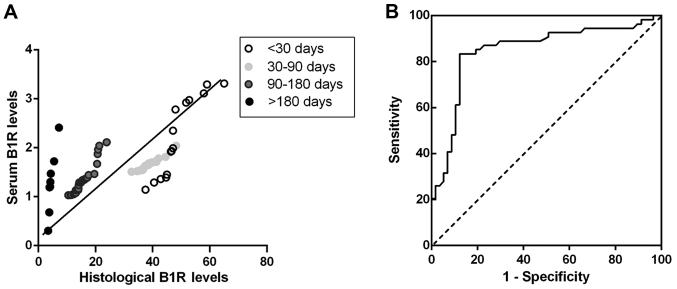
Figure 4.
Serum B1R levels for predicting vulnerable plaque in patients of stroke groups. (A) Histological levels of B1R in individual patients were correlated with the serum values of B1R in Stroke groups of <30, 30–90, 90–180 and >180 days (r=0.54, P<0.001). The regression curve line and significance values are shown in the plots. (B) Receiver-operating curve of B1R level for predicting vulnerable plaque in patients. The area under the curve of B1R levels were obtained from stroke patients.

