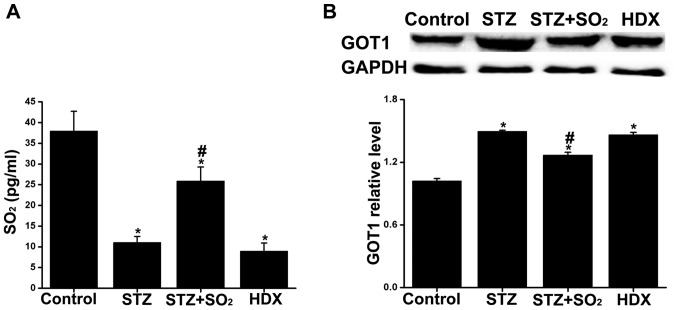
Figure 2.
(A) Quantification of myocardial SO2 content in rats from each group and SO2 synthase aspartate aminotransferase (GOT1) protein expressions in each group (B) Data are expressed as mean ± standard deviation (n=3). *P<0.05 vs. control group; #P<0.05 vs. STZ group. SO2, sulfur dioxide; STZ, streptozotocin; HDX, L-Aspartic acid β-hydroxamate.

