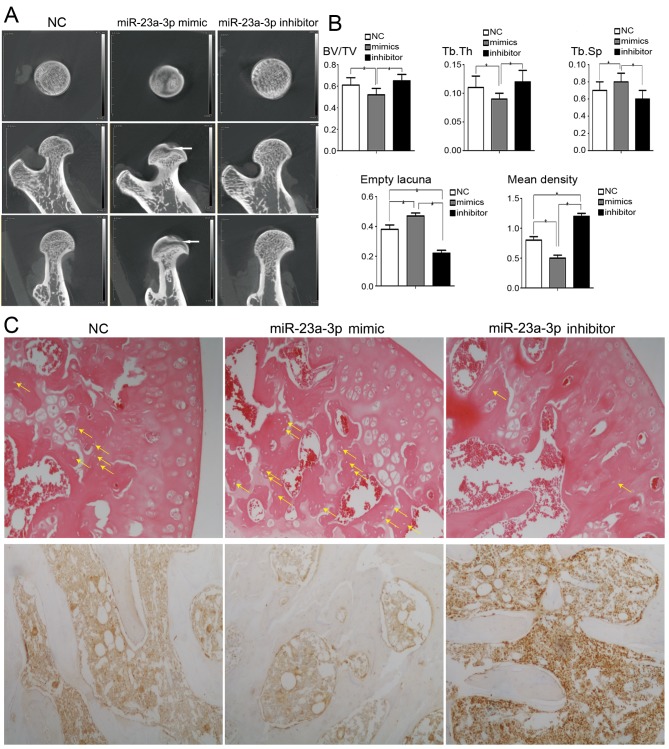
Figure 4.
Quantitative analysis of alterations in femoral parameters associated with bone thickness and density. (A) Representative micro computed tomography images of the proximal femur. miR-23a-3p-inhibitor: The shape of the femoral head was round with condensed trabeculae. miR-23a-3p-mimic: The femoral head was flattened and the trabeculae were scattered with cystic degeneration (white arrow). (B) Bar graphs demonstrating that BV/TV and Tb.Th were lower in the miR-23a-3p mimic group, and Tb.Sp was higher in the miR-23a-3p mimic group. The incidence of empty bone lacunae number was lower in the miR-23a-3p inhibitor group. The mean density of immunohistochemical images of LRP-5 positive cell was higher in the miR-23a-3p inhibitor group. *P<0.05. (C) The average number of empty bone lacuna (yellow arrow) was decreased in the miR-23a-3p inhibitor group compared with NC and miR-23a-3p mimic groups (hematoxylin and eosin stained; magnification, ×100). Representative immunohistochemical images demonstrating a higher intensity of LRP-5 staining in miR-23a-3p inhibitor group compared with the NC and miR-23a-3p mimic groups (magnification, ×100)., NC, negative control; BV/TV, bone volume/ total volume; Tb.Th, trabecular thickness; Tb.Sp, trabecular spacing; LRP-5, low density lipoprotein receptor-related protein-5; miR, microRNA.

