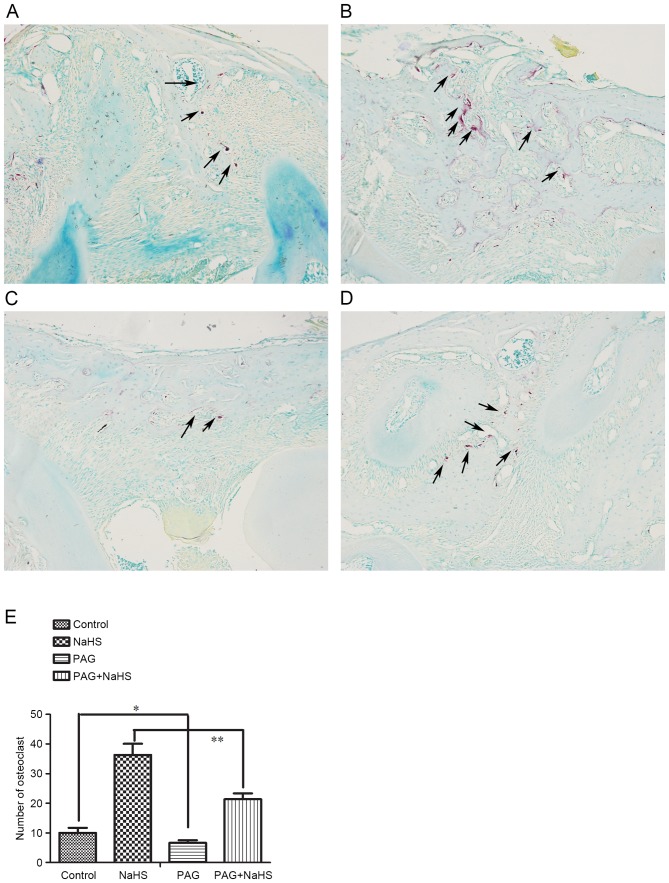
Figure 4.
Tartrate-resistant acid phosphatase+ osteoclasts in alveolar bone between first and second molar in the (A) control, (B) NaHS, (C) PAG and (D) PAG+NaHS groups. Magnification, ×100. (E) Quantification of the number of osteoclasts among the groups following each treatment. Arrows indicate the osteoclasts. Data are presented as the mean ± standard deviation. *P<0.05; **P<0.01. OTM, orthodontic tooth movement; NaHS, sodium hydrosulfide; PAG, propargylglycine.

